| BF-BOF | Blast Furnace with Basic Oxygen Furnace | |
| DRI-COAL-EAF | Direct Reduction of Iron with Coal, followed by Electric Arc Furnace | |
| DRI-GAS-CCS-EAF | Direct Reduced Iron with Natural Gas, followed by Electric Arc Furnace, 90% of CO2 is Captured and Stored | |
| DRI-GAS-EAF | Direct Reduced Iron with Natural Gas, followed by Electric Arc Furnace | |
| DRI-H2-EAF | Direct Reduced Iron with Green Hydrogen, followed by Electric Arc Furnace | |
| LTAE | Low Temperature Alkaline Electrolysis | |
| EAF-SCRAP | Electric Arc Furnace used with Scrap | EAF-PRIMARY | Electric Arc Furnace used with Green Iron / Hot Briquetted Iron |
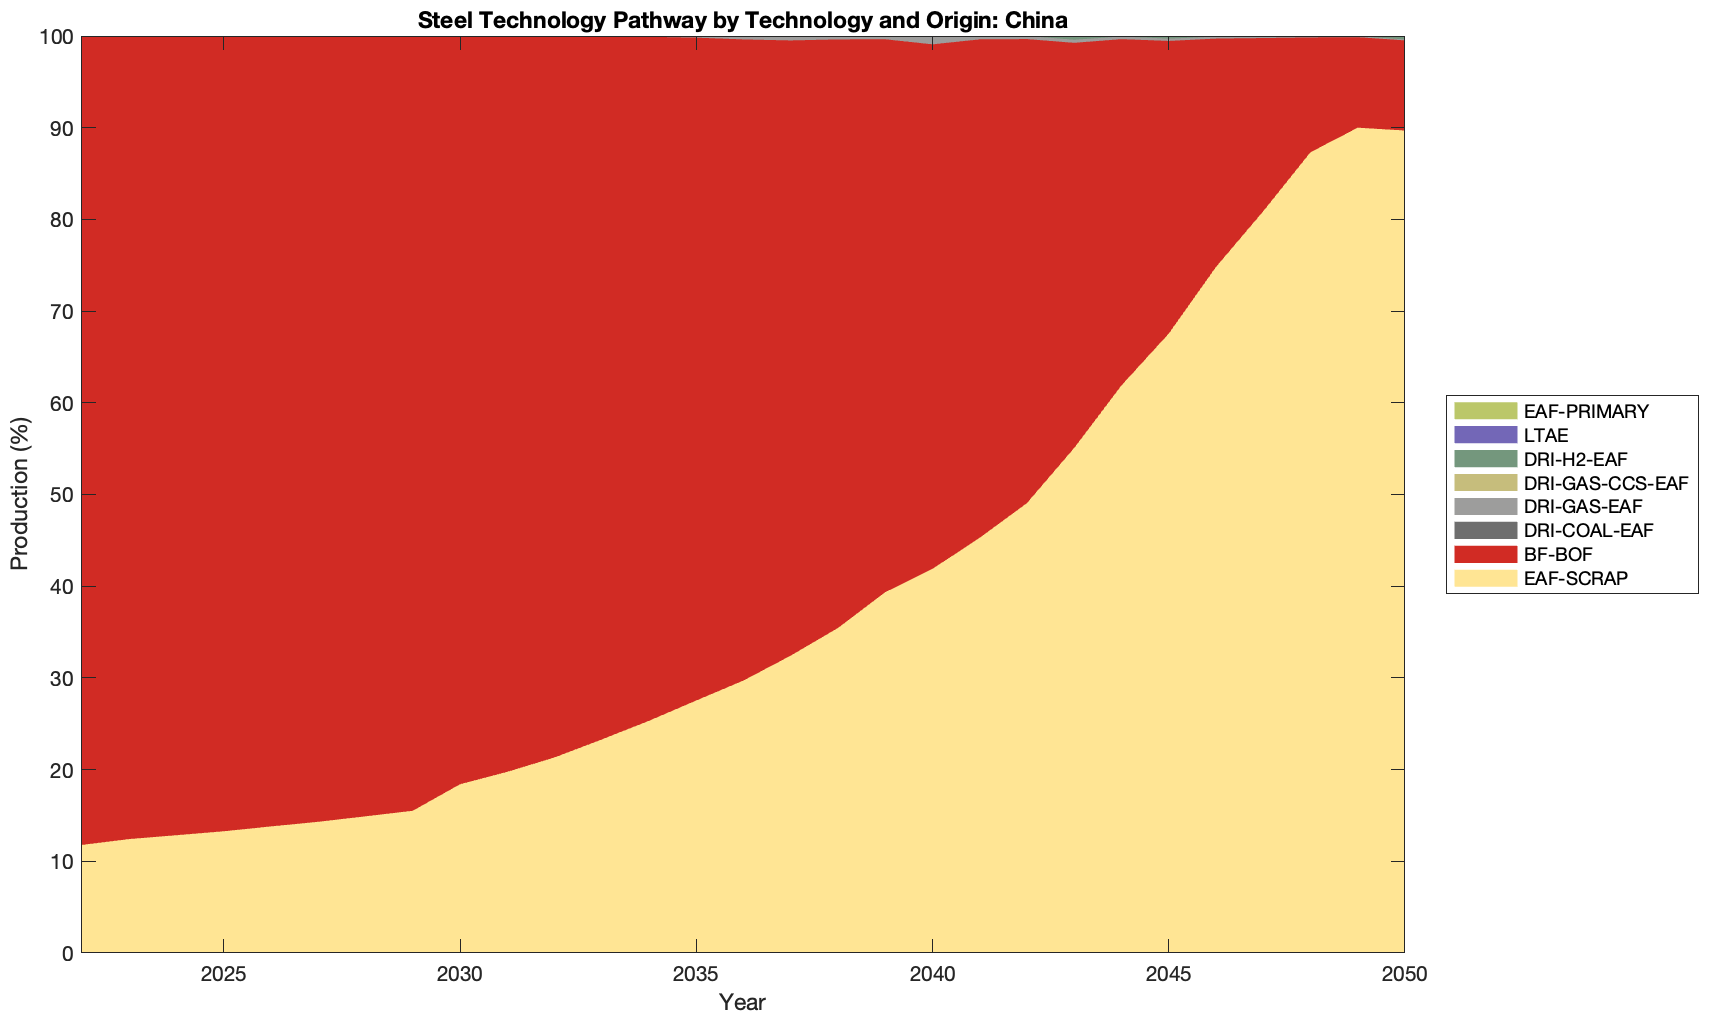
Pathways
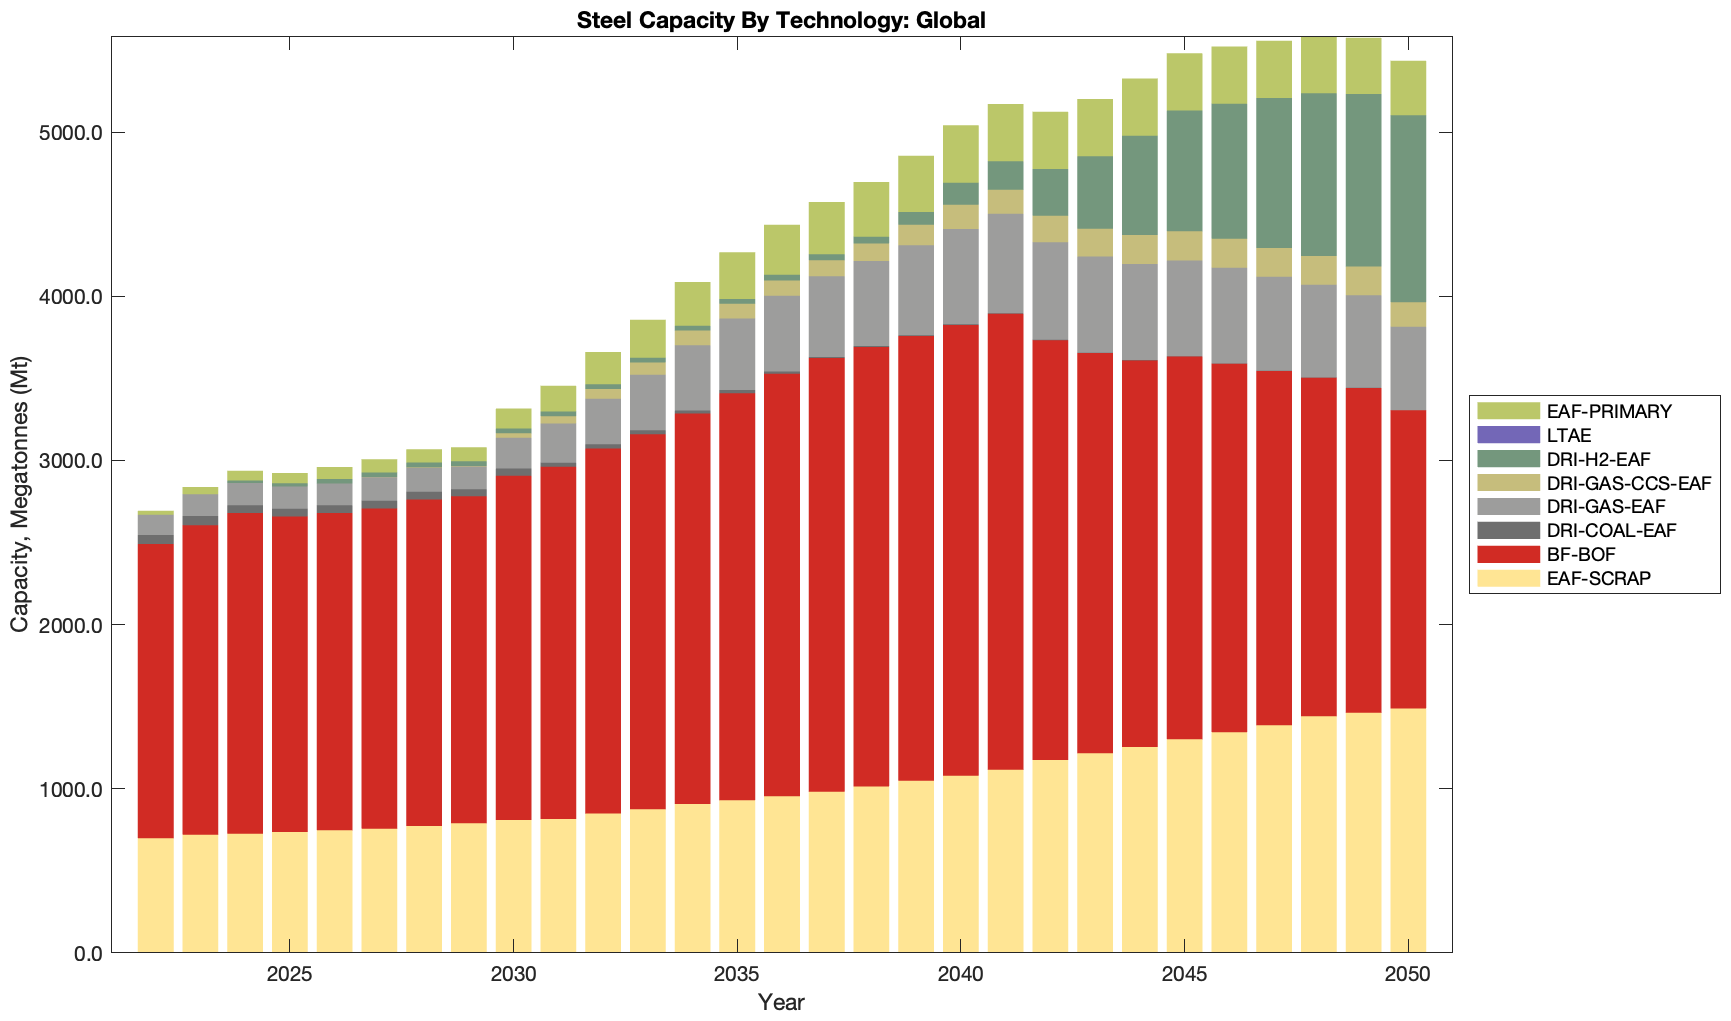
Capacities
Production
Emissions
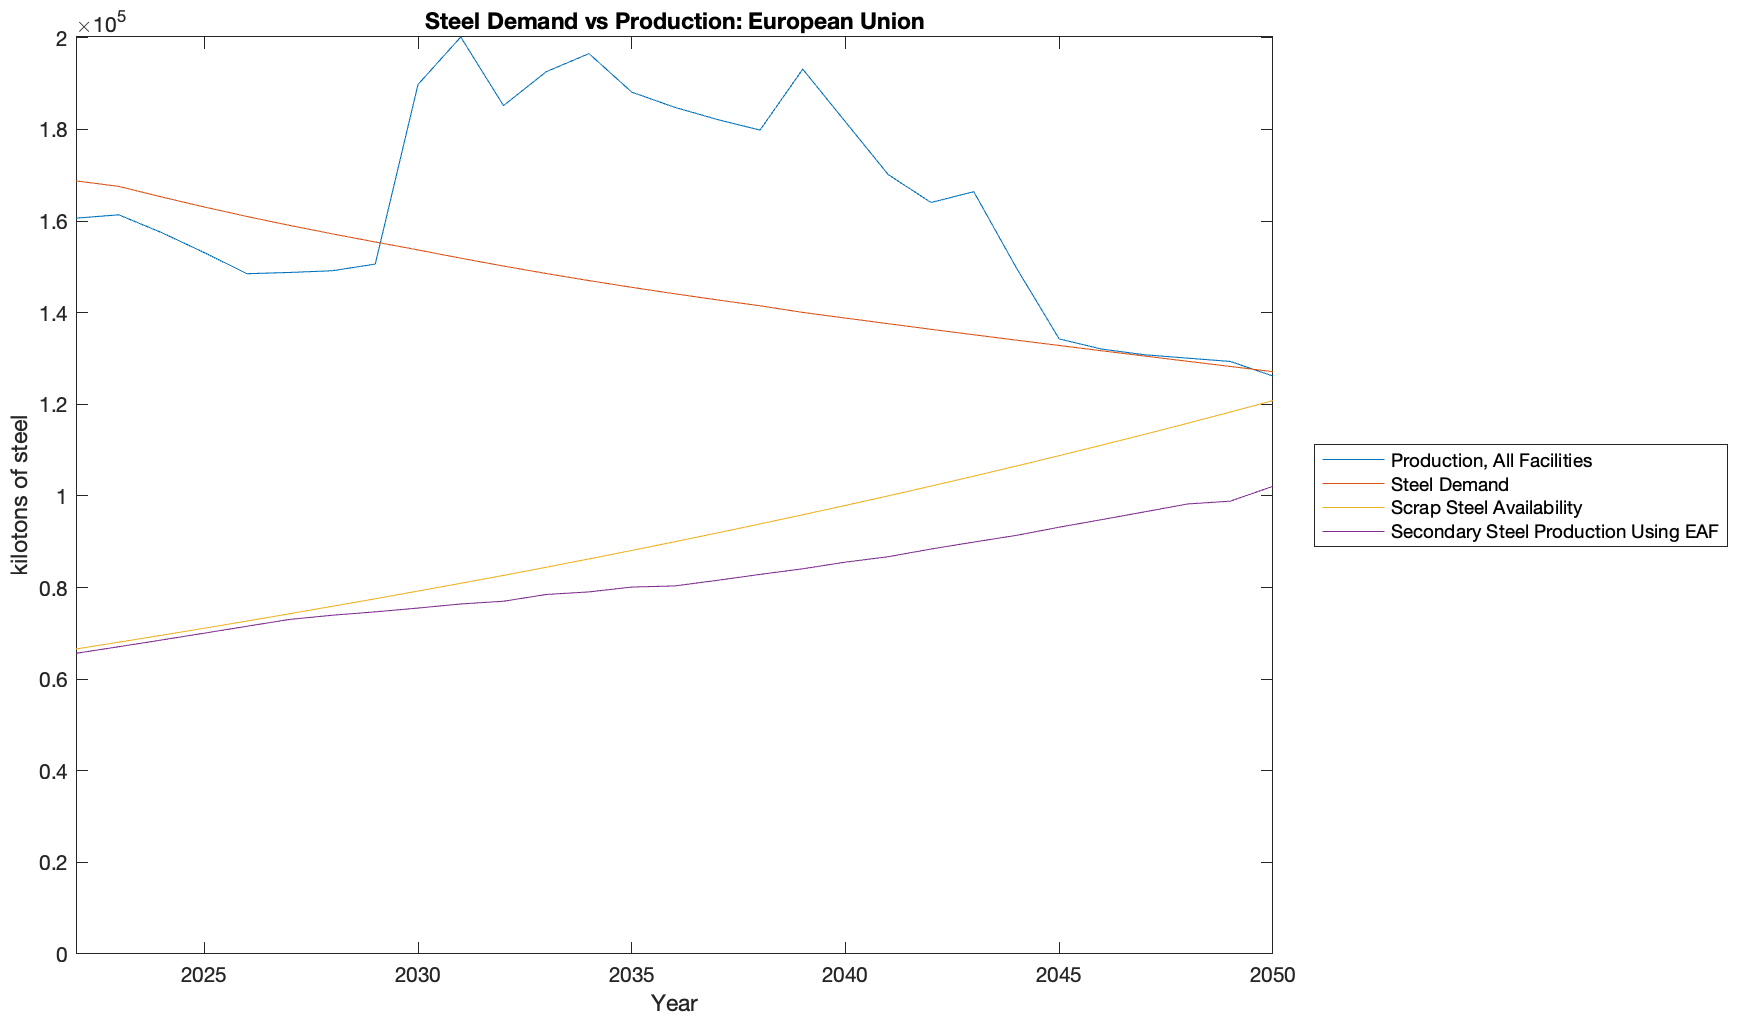
Demand vs production
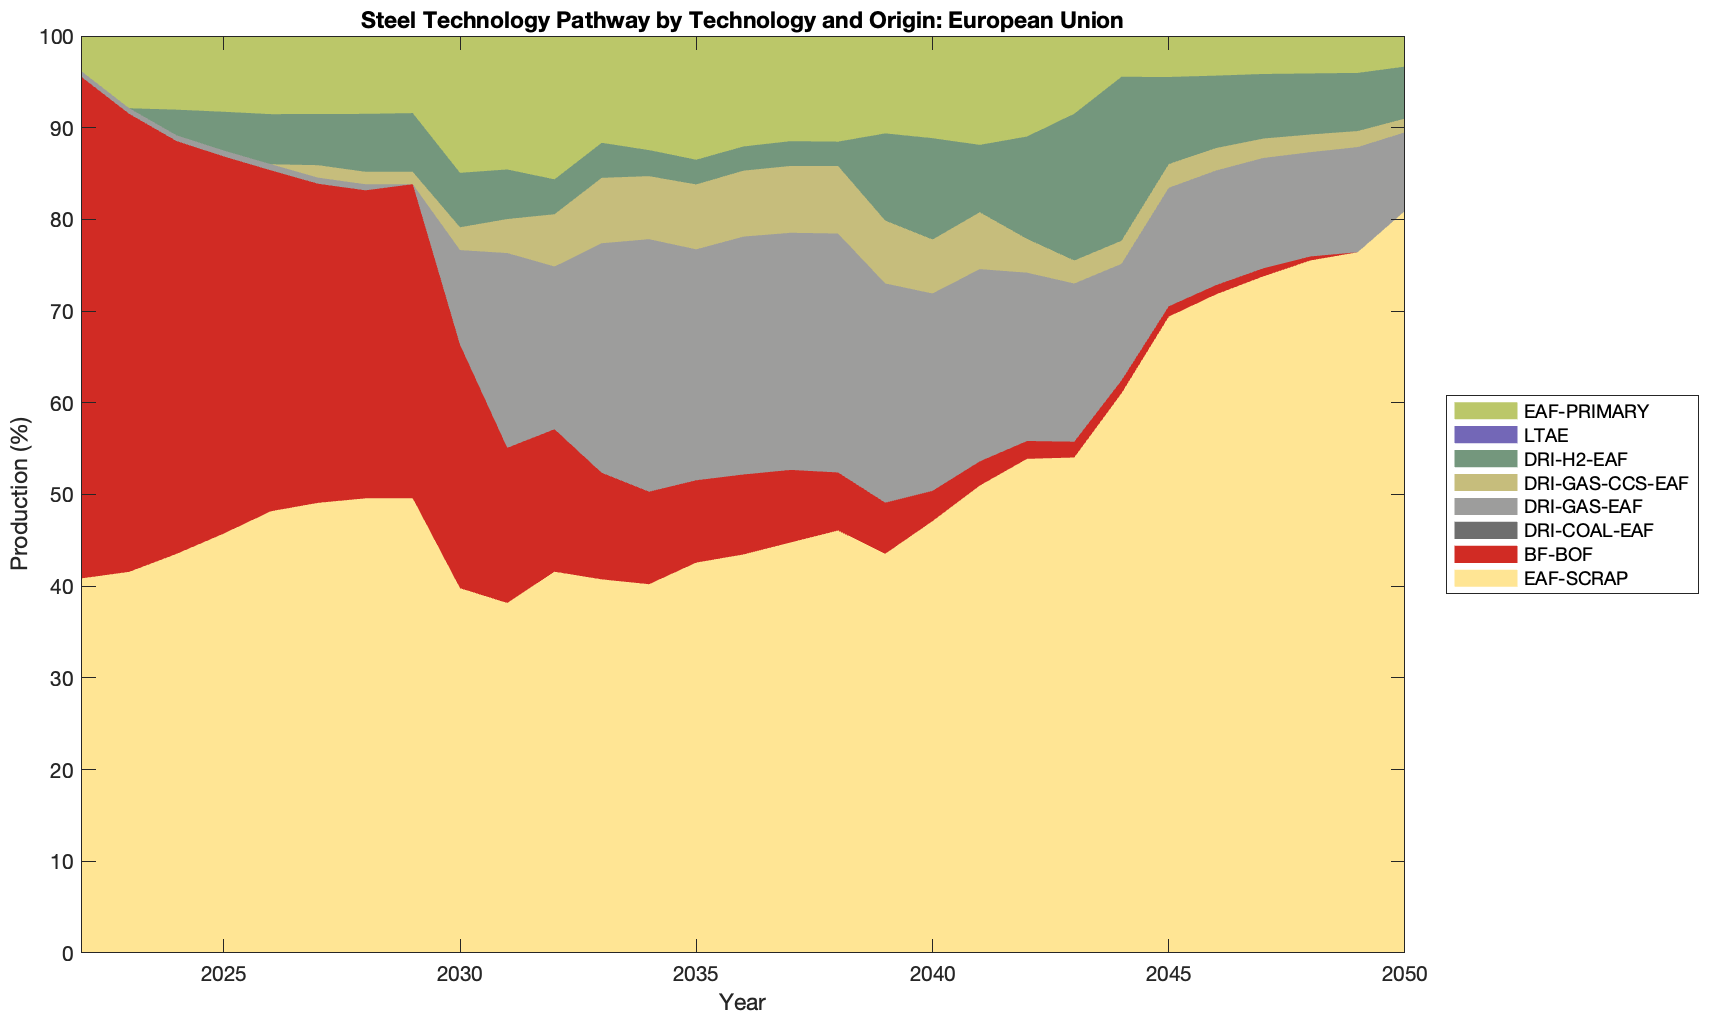
Pathways
China
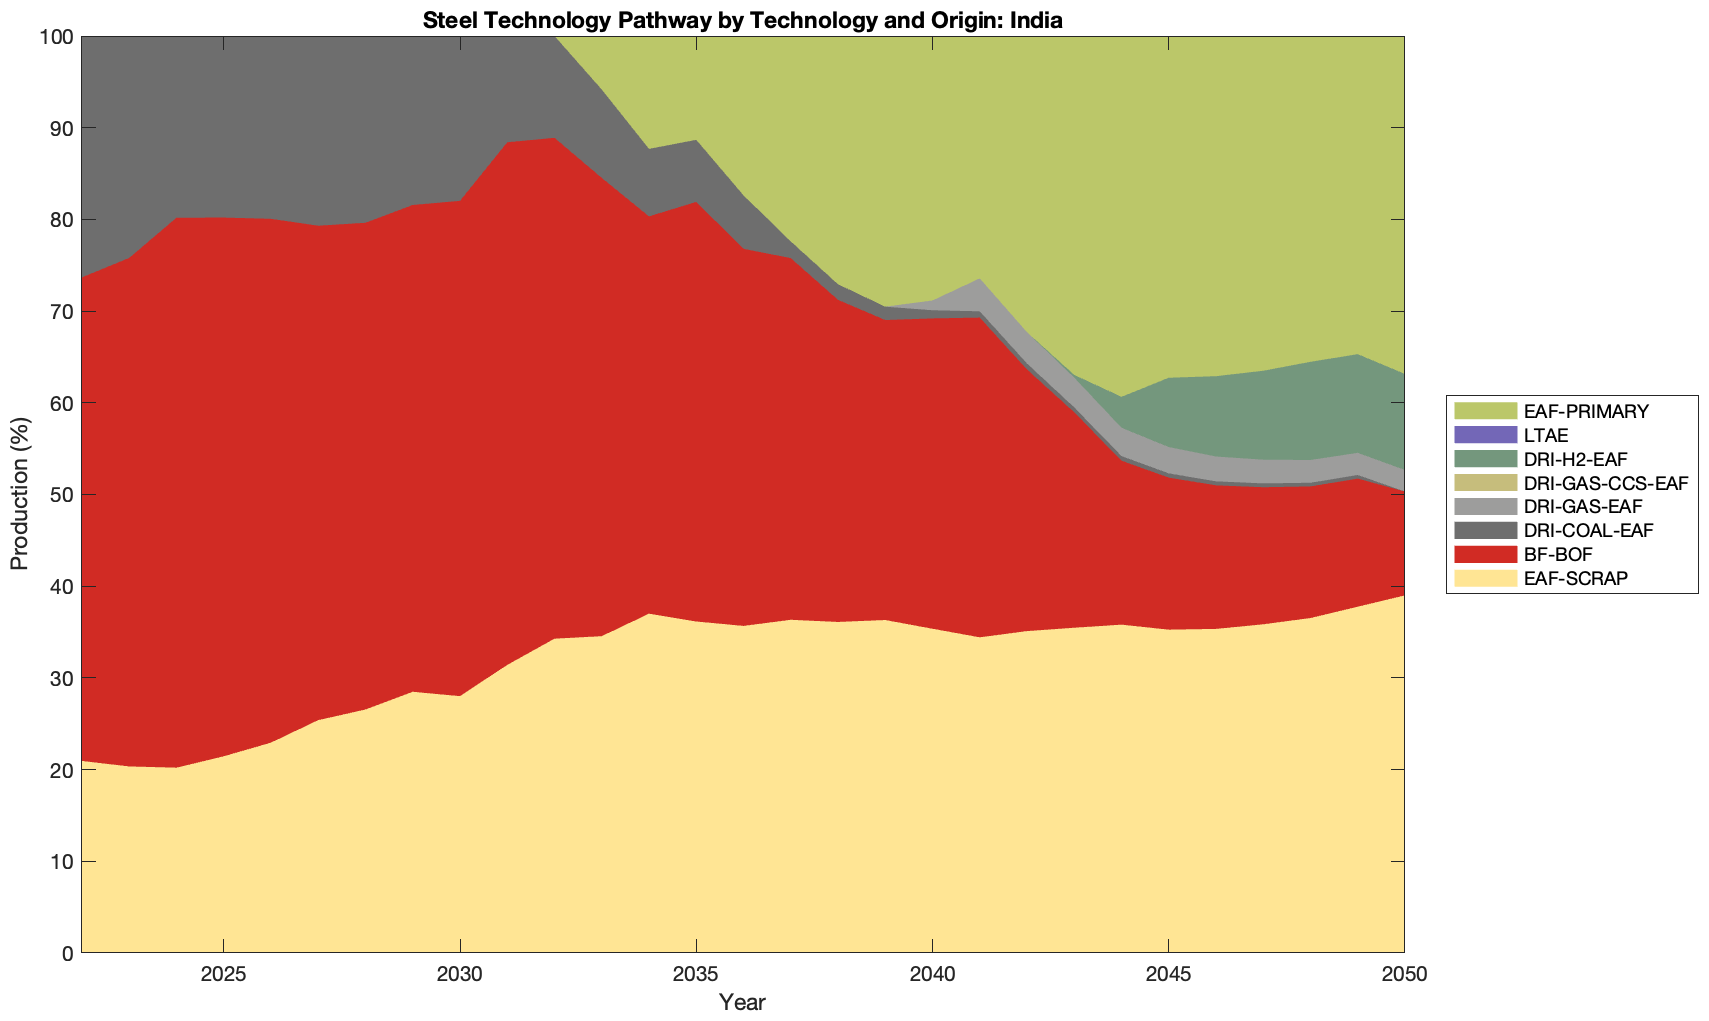
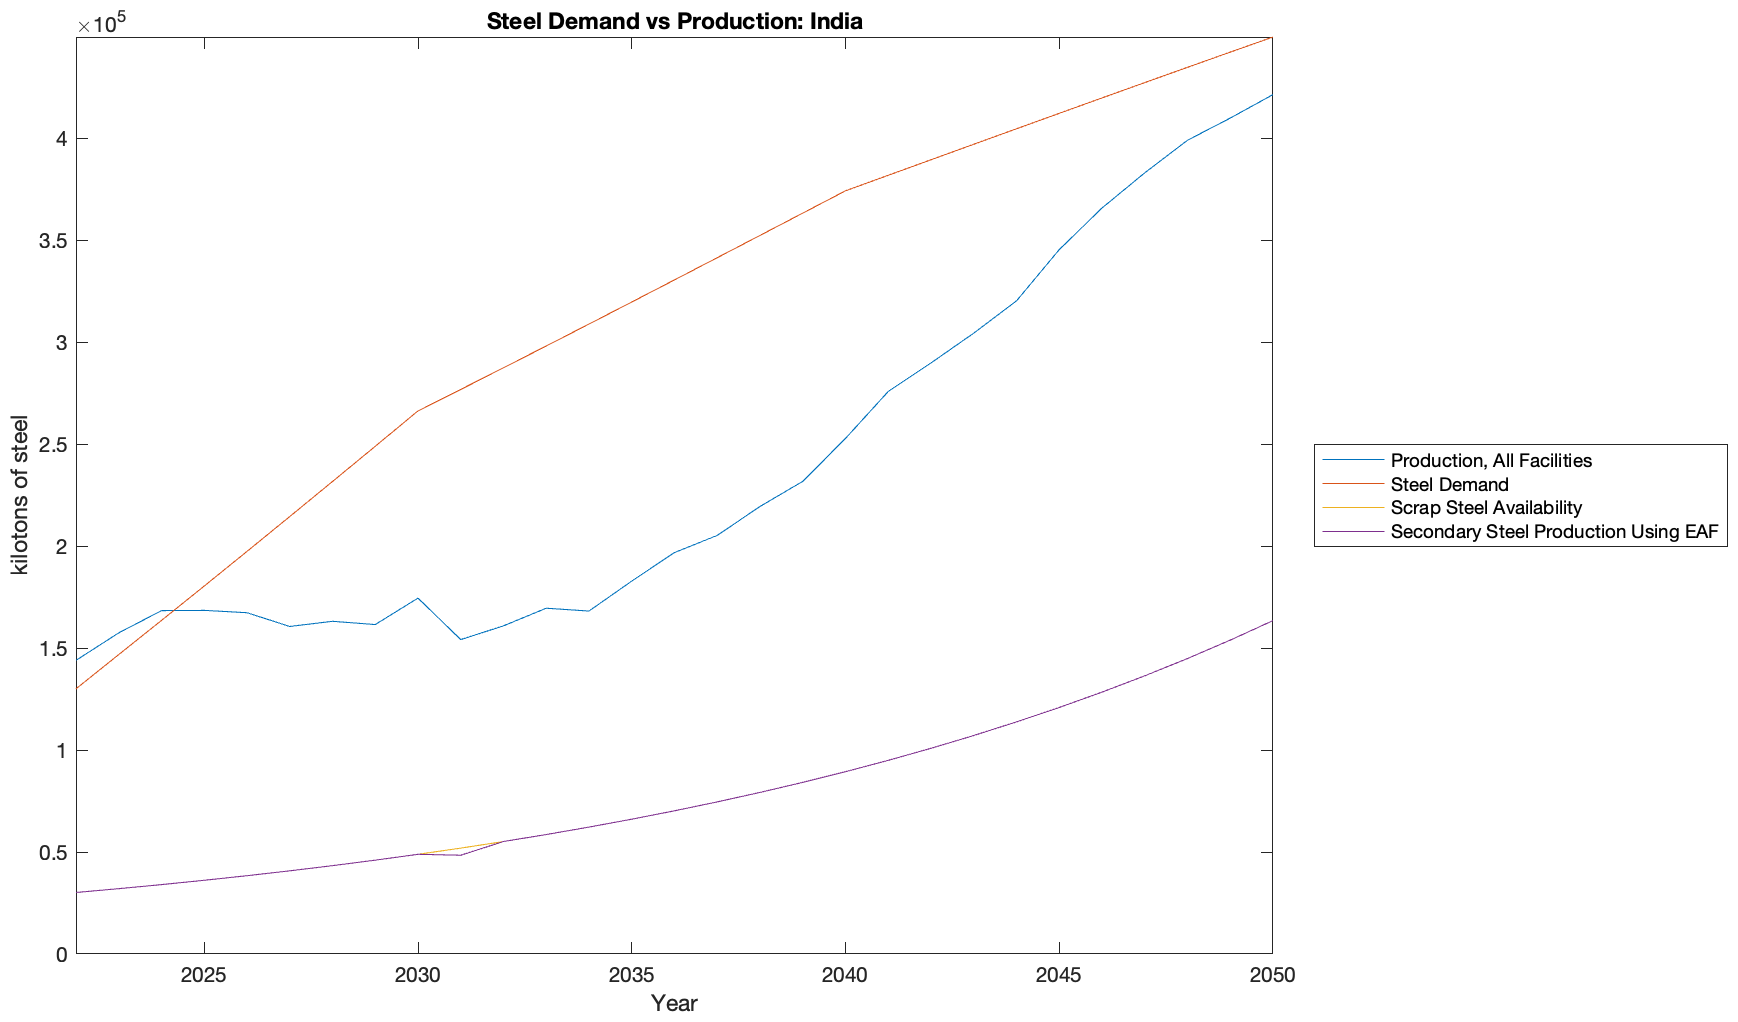
India
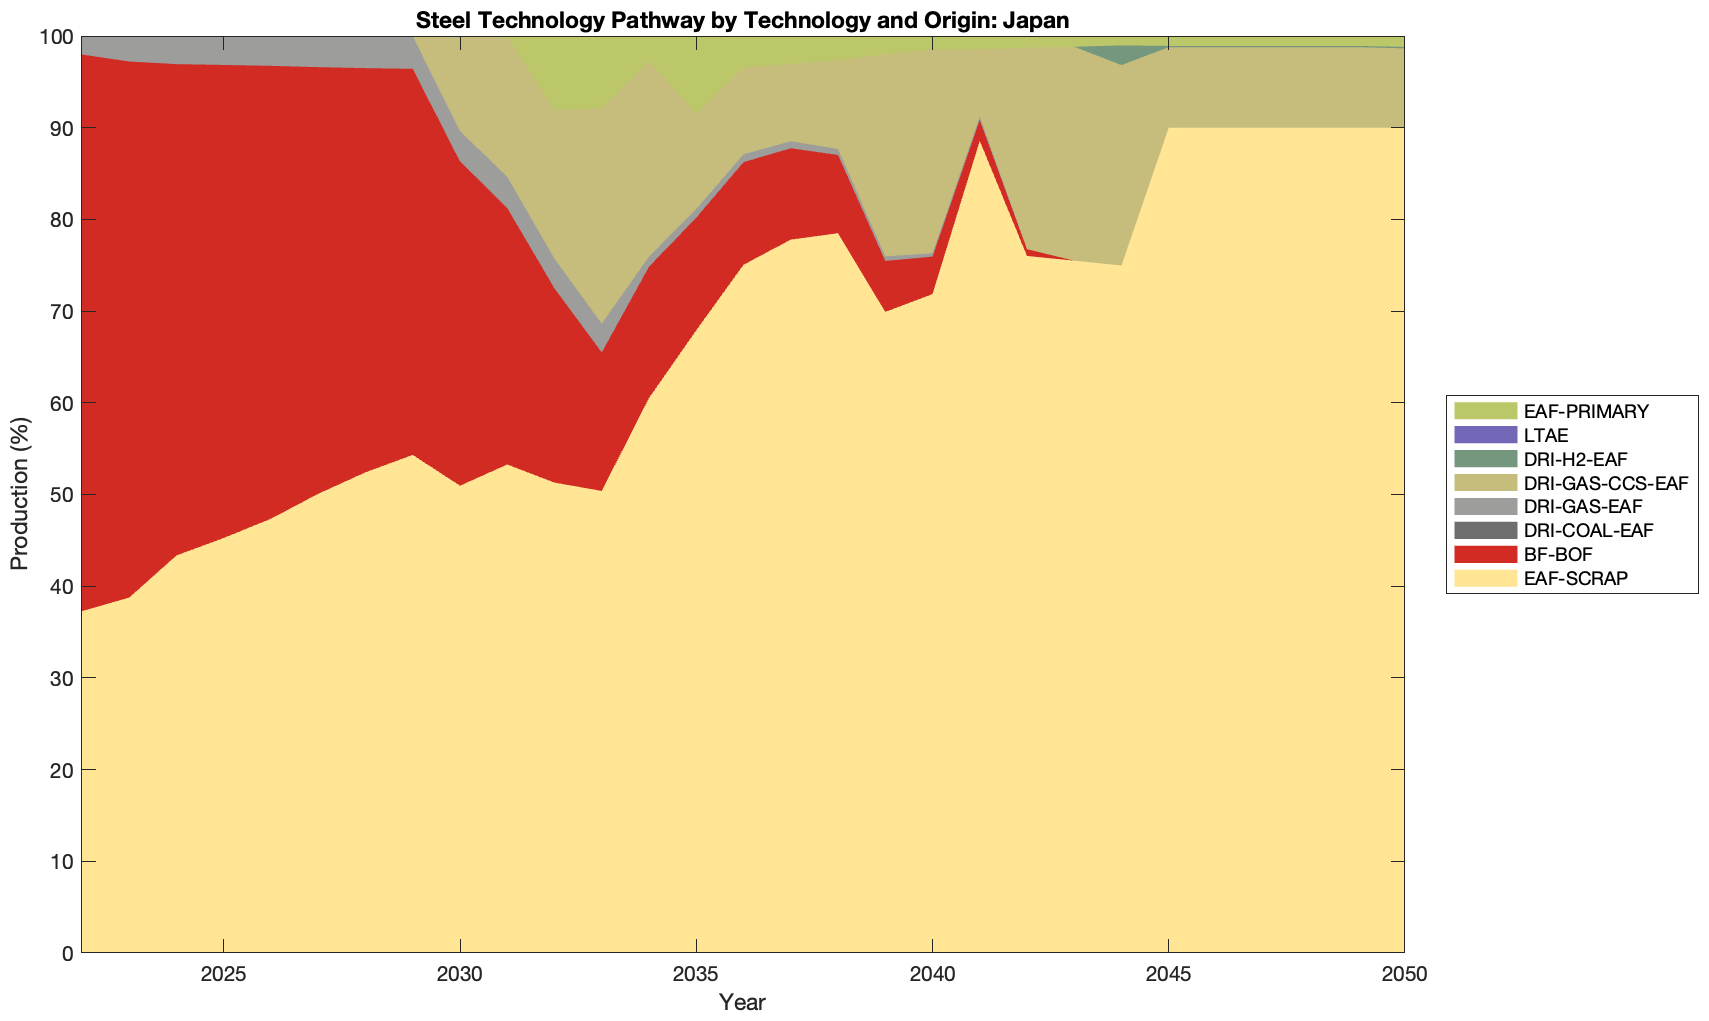
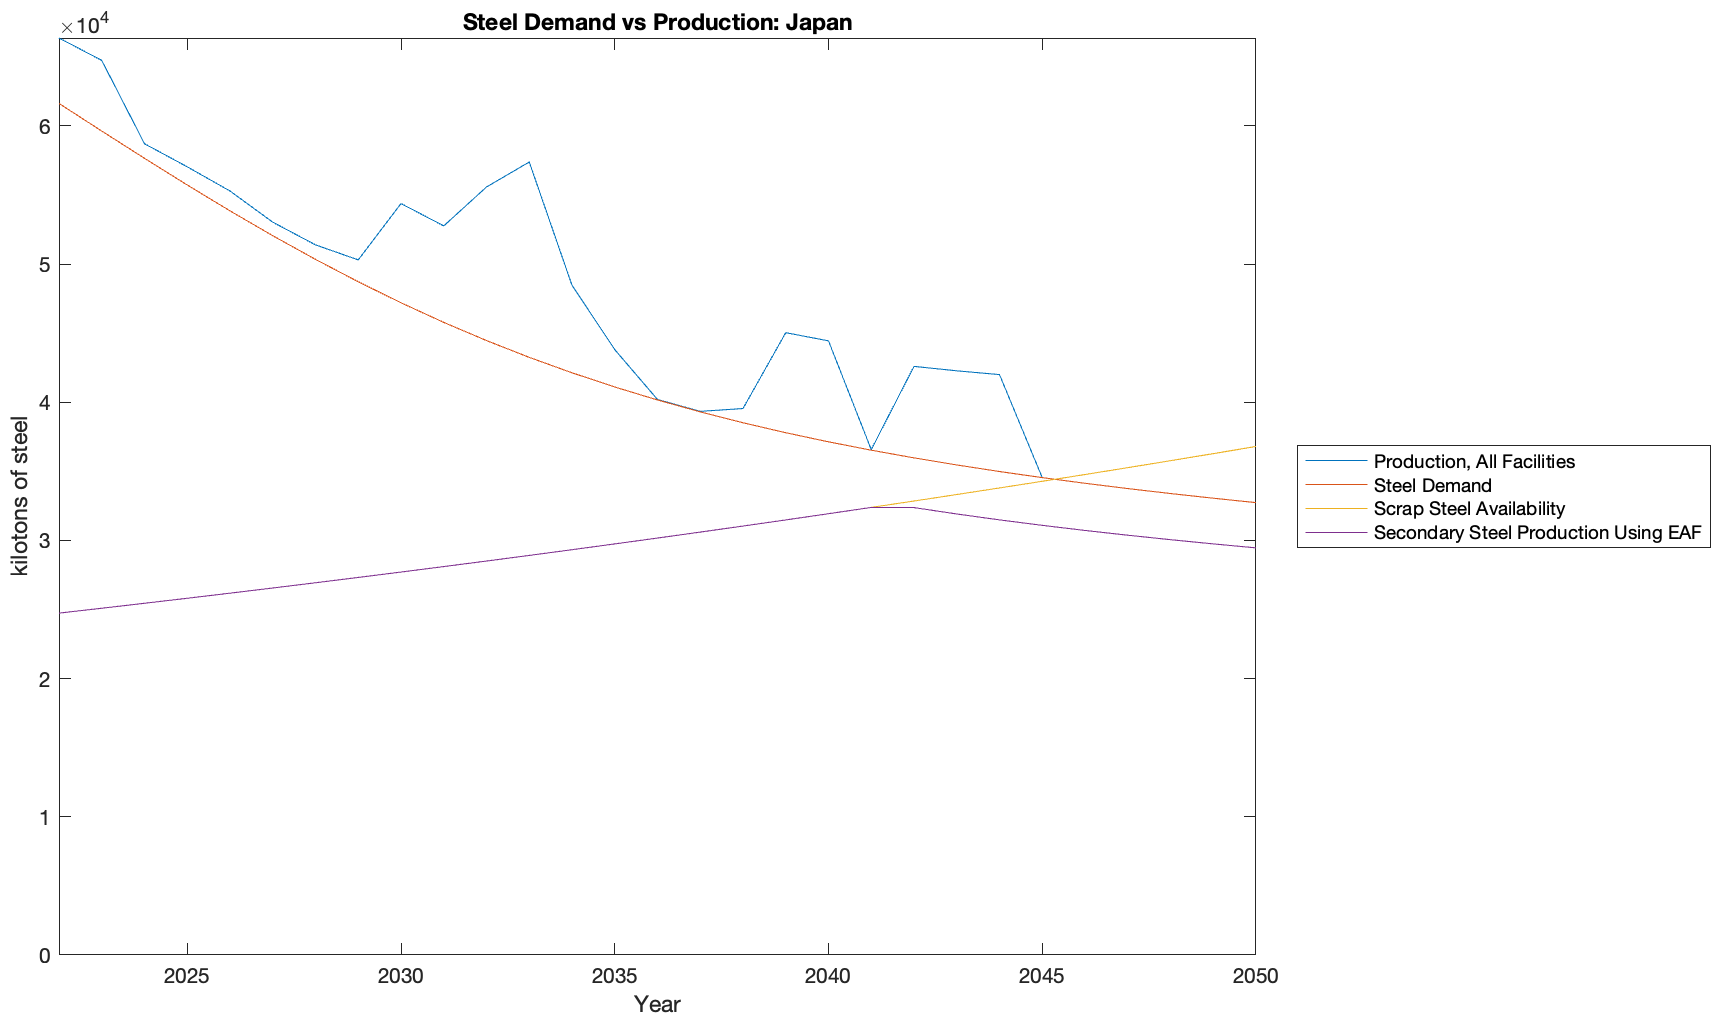
Japan
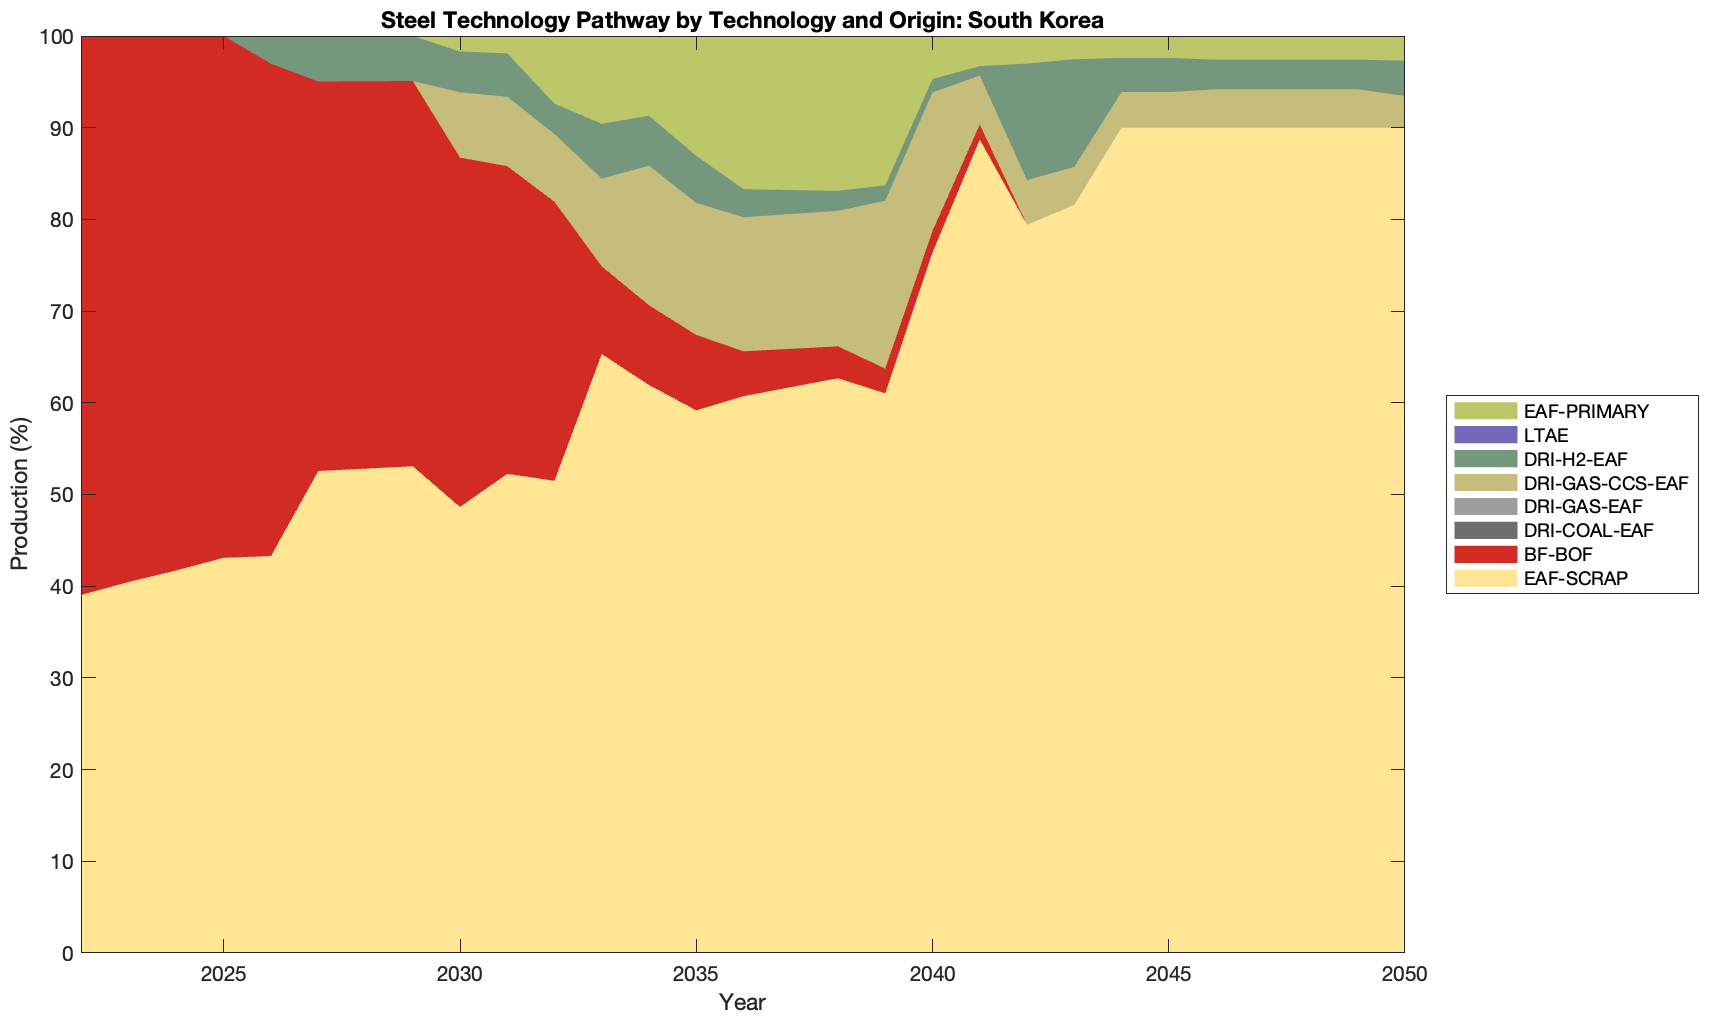
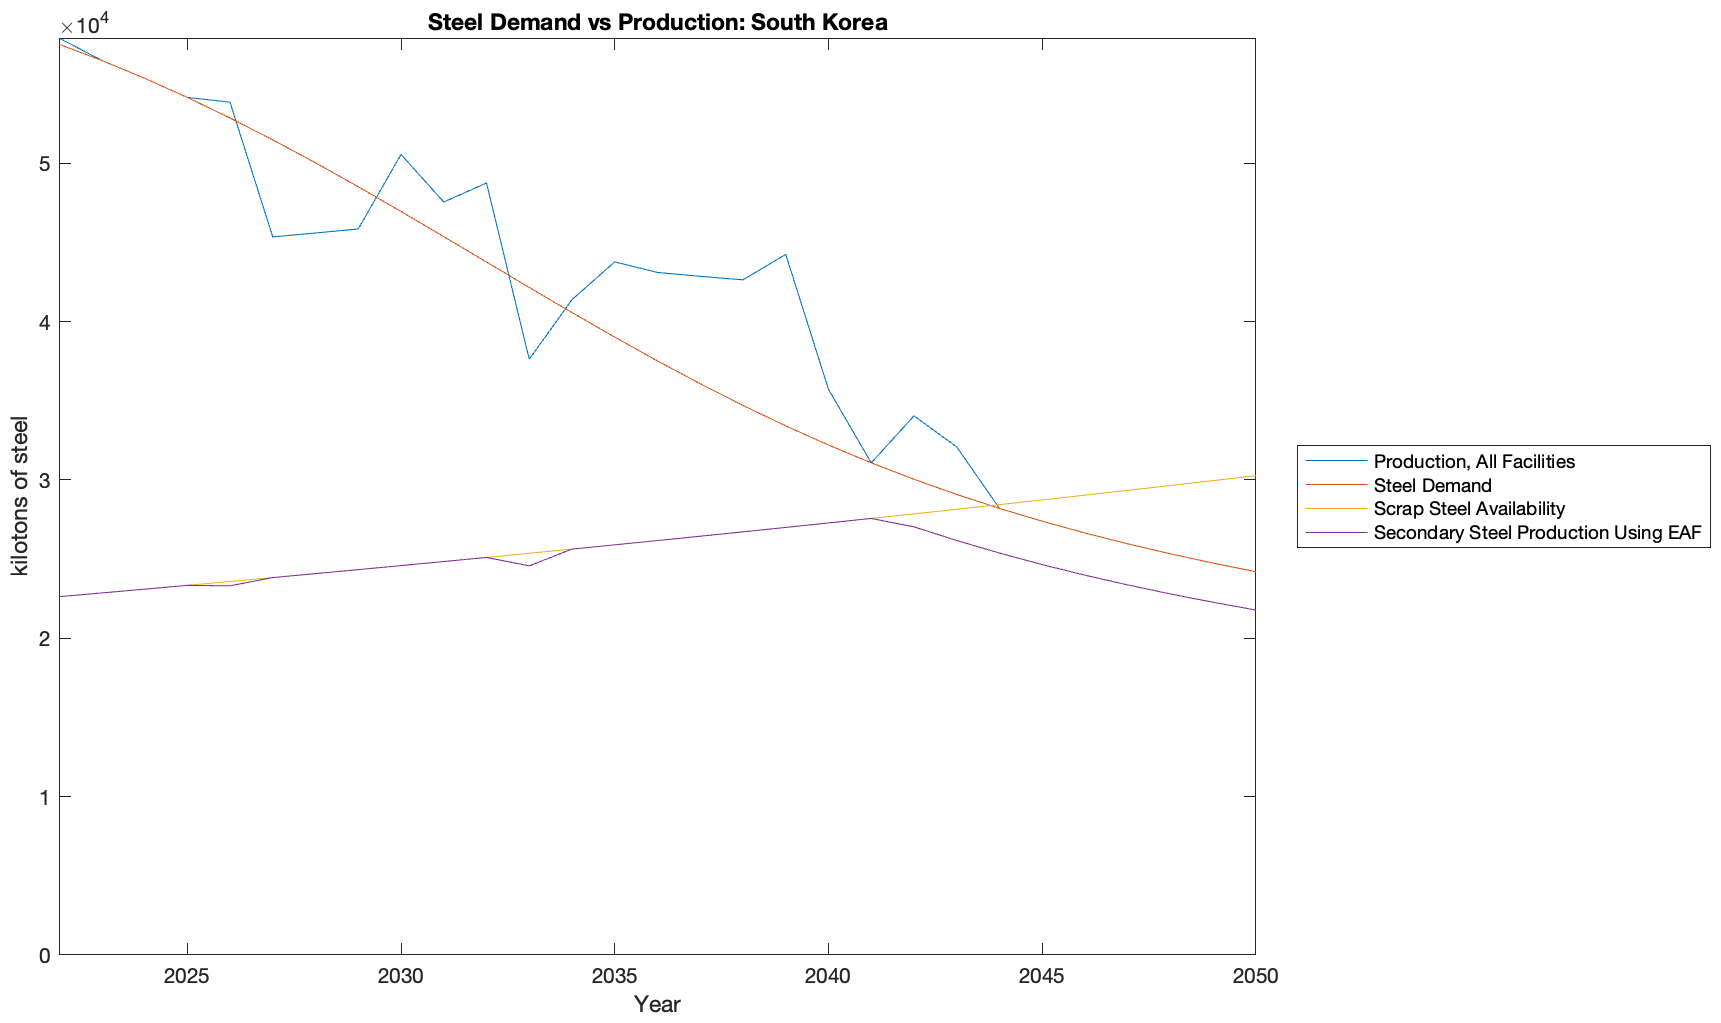
South Korea
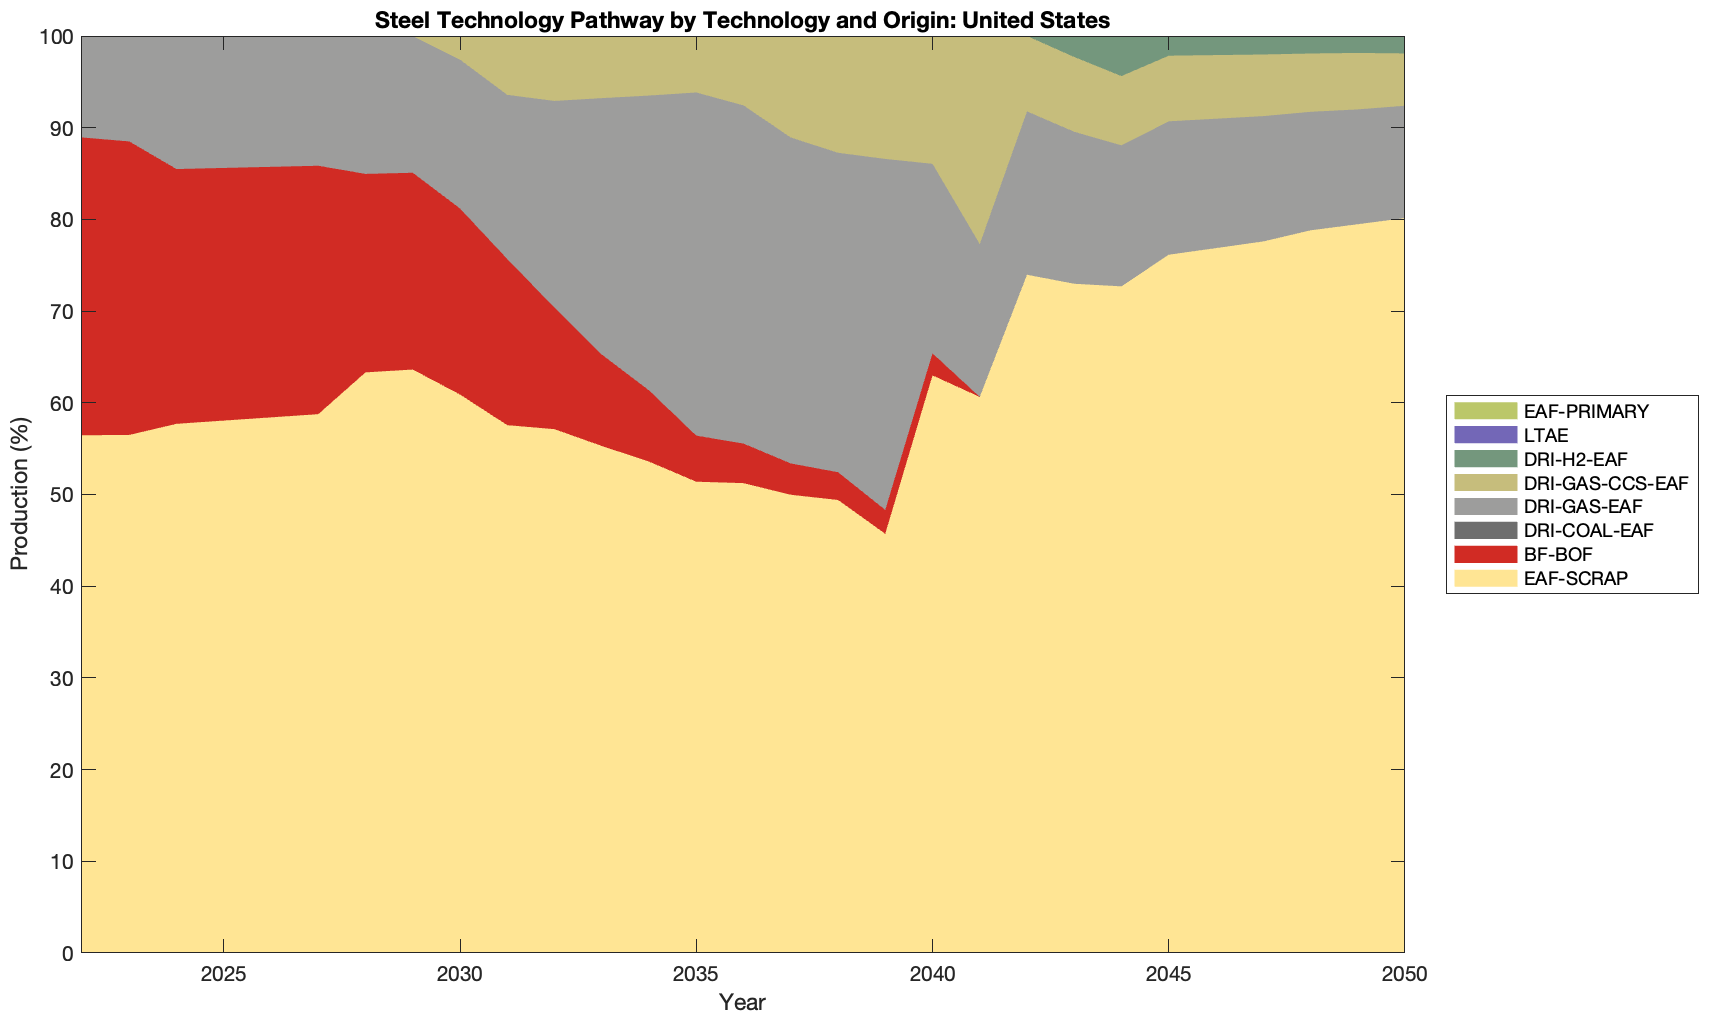
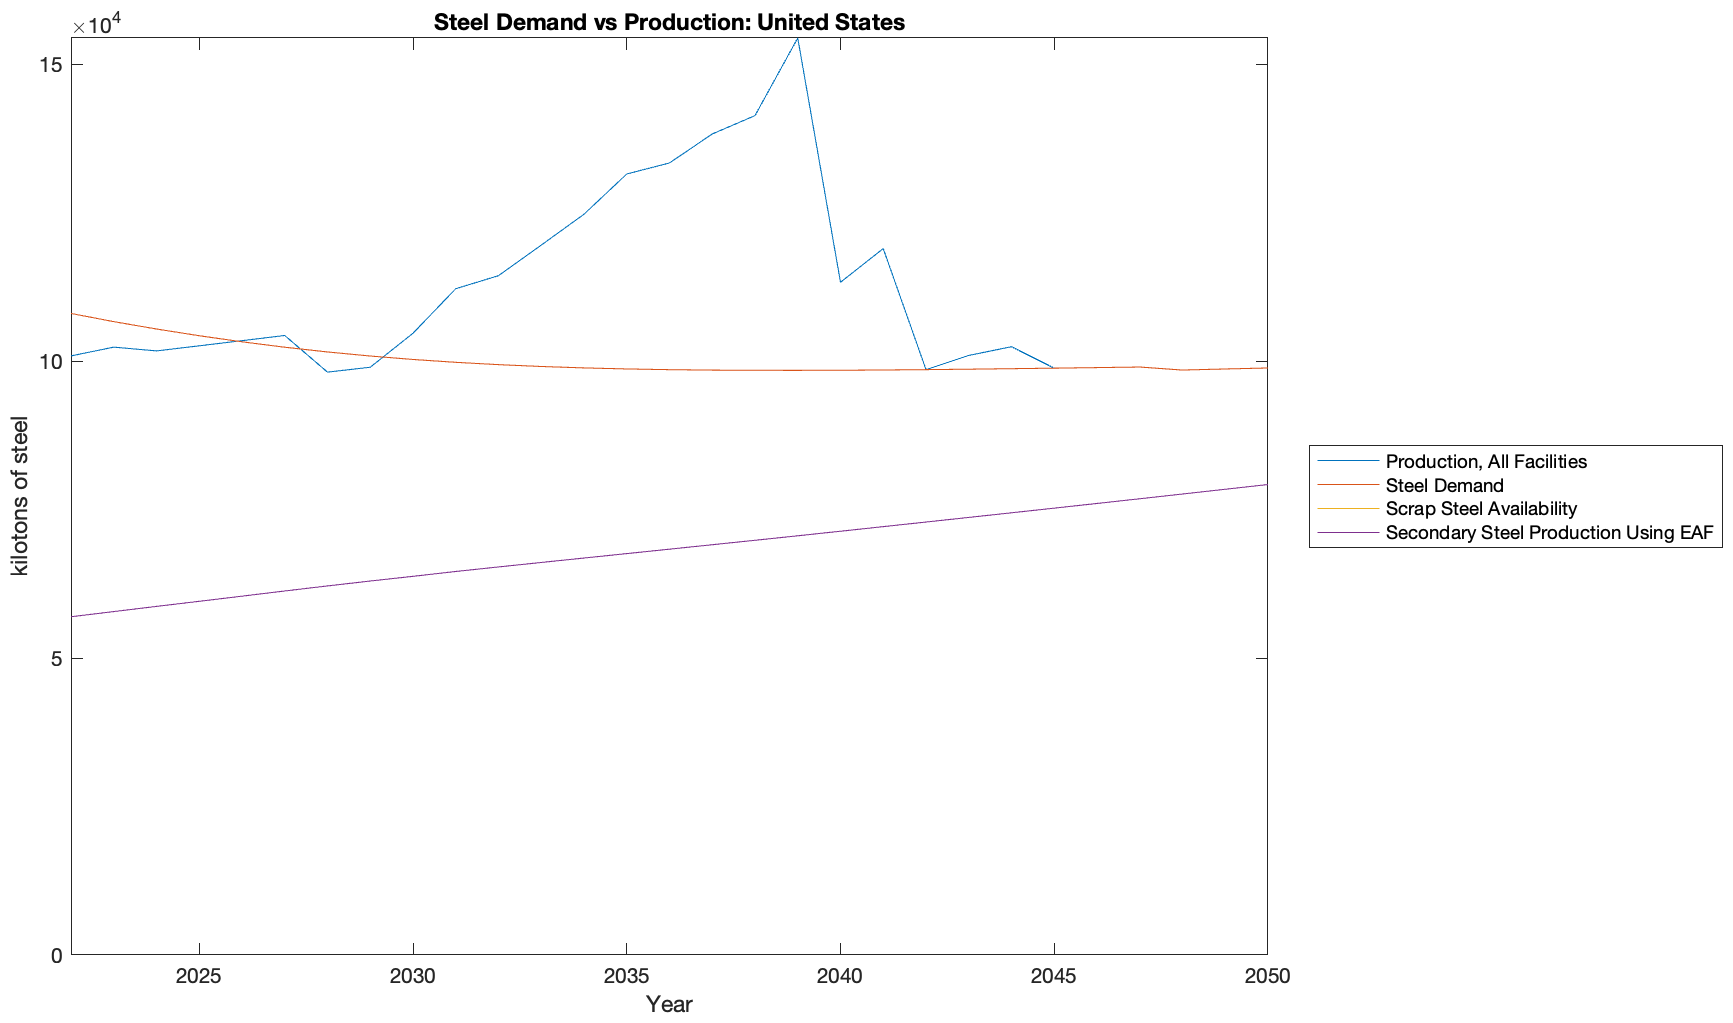
United States
European Union
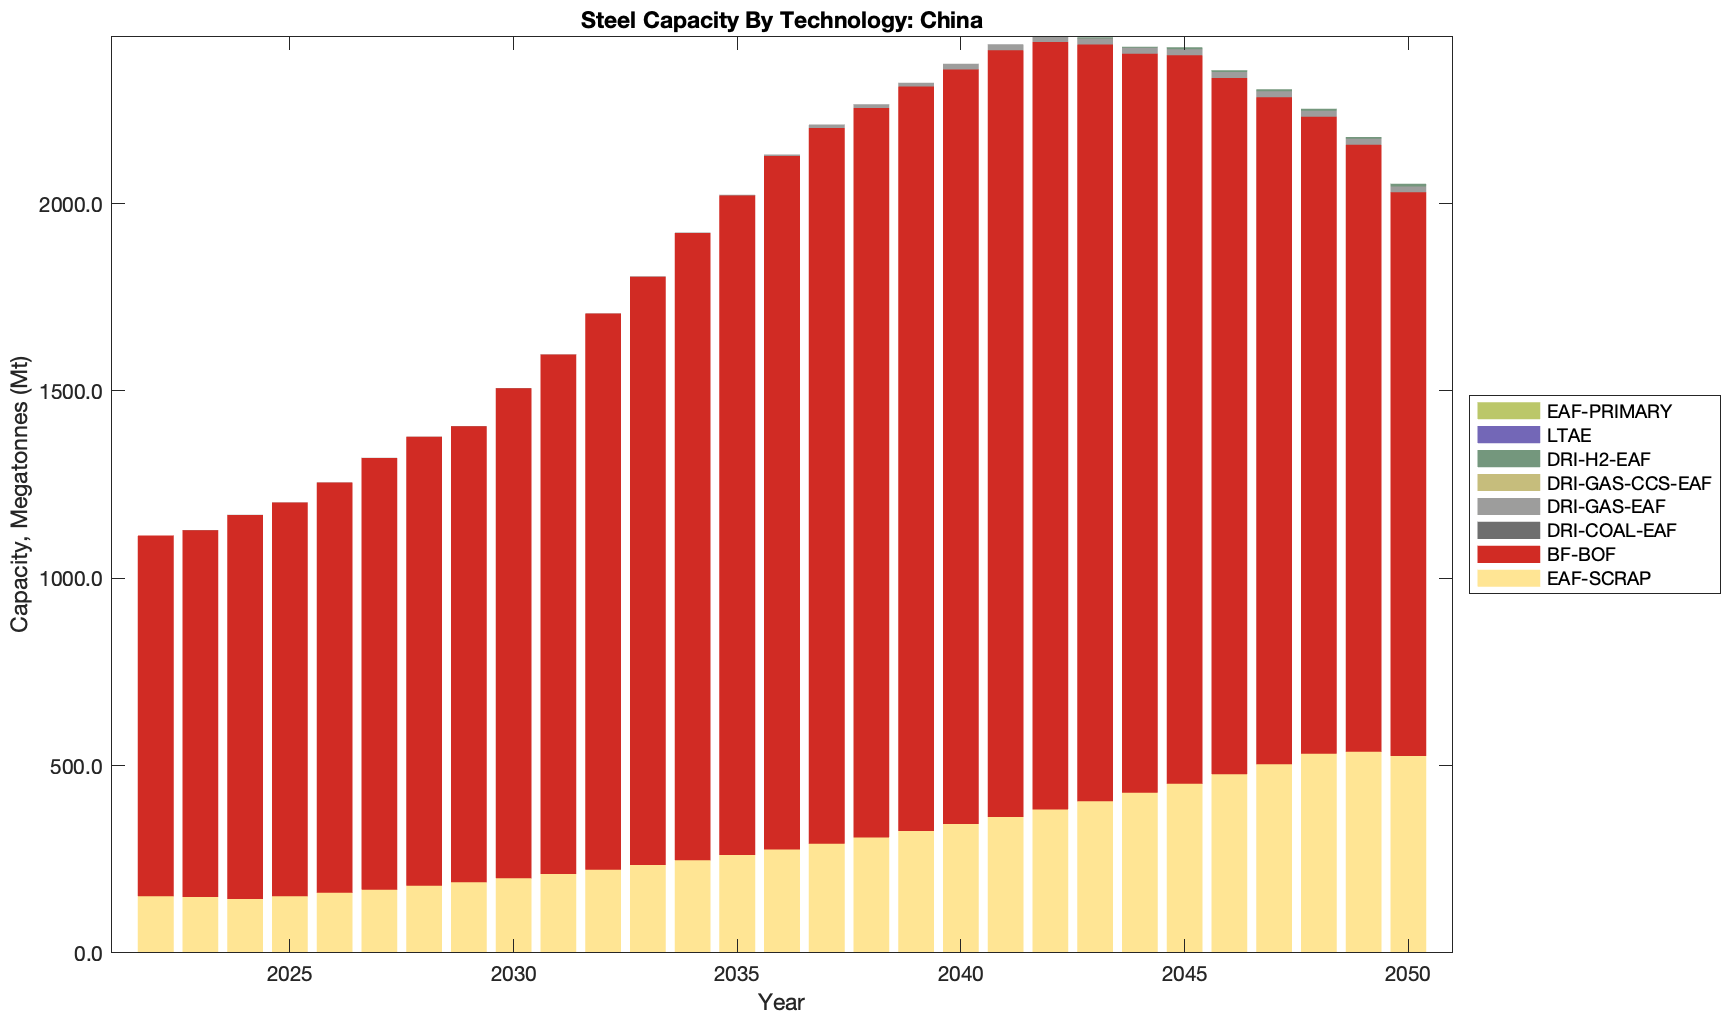
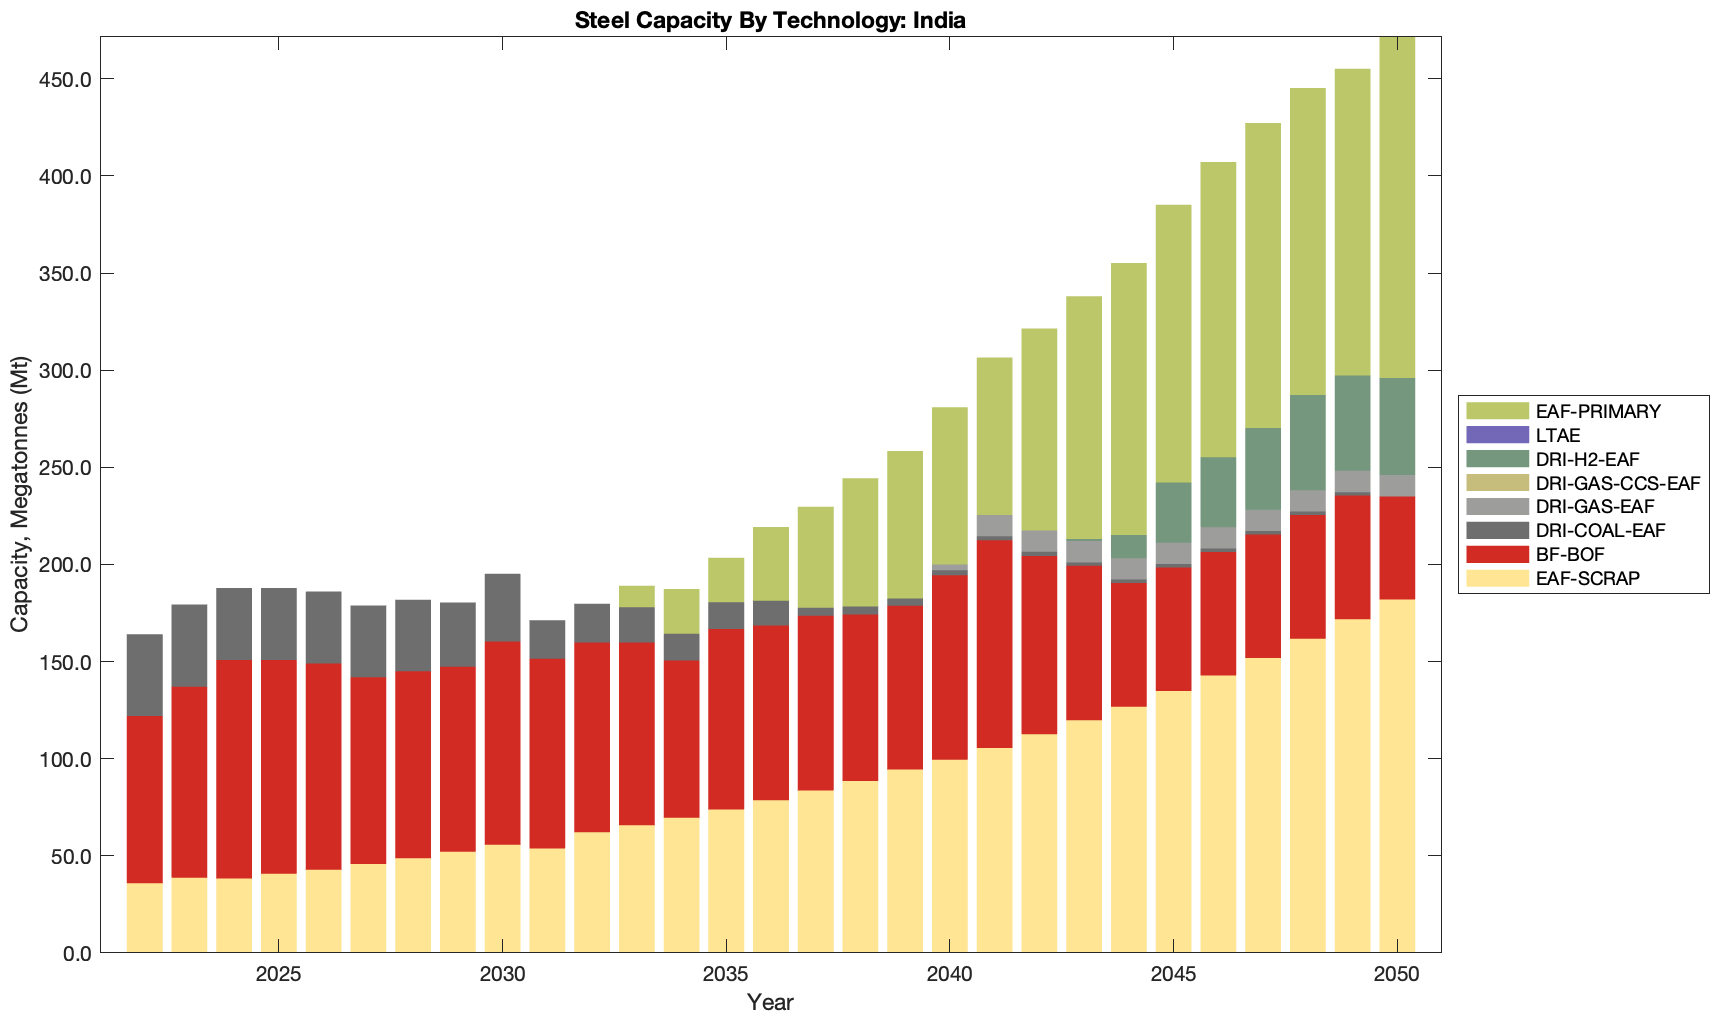
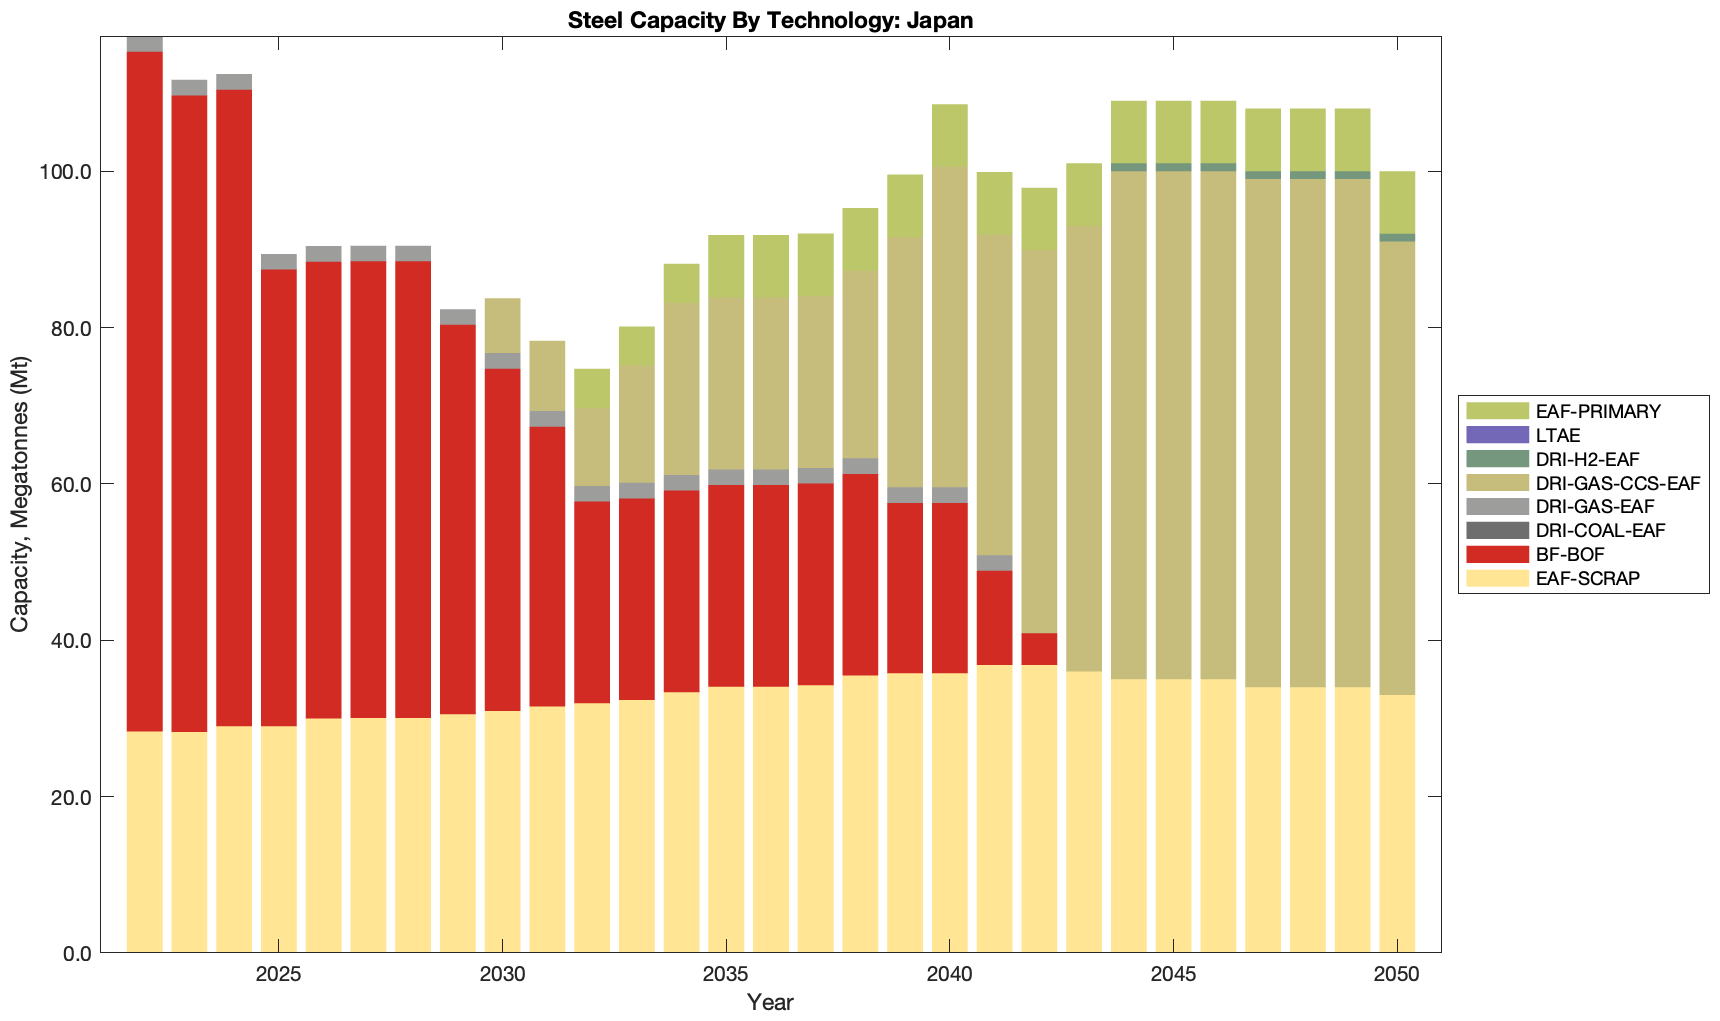
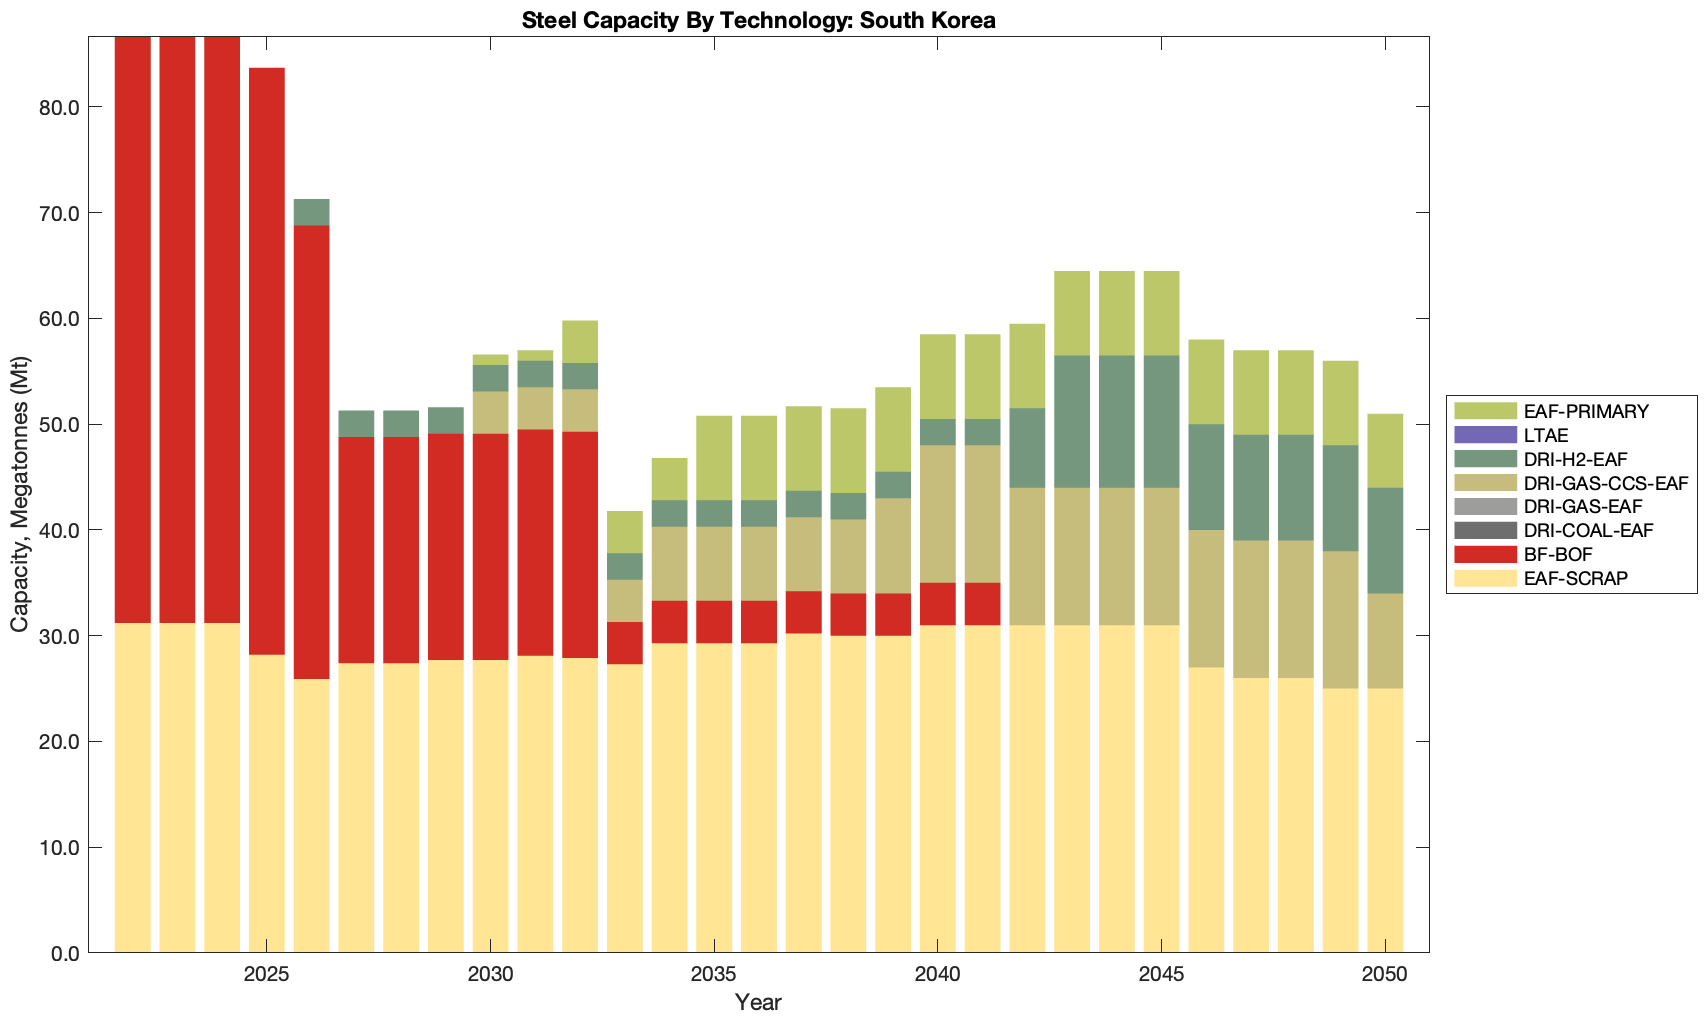
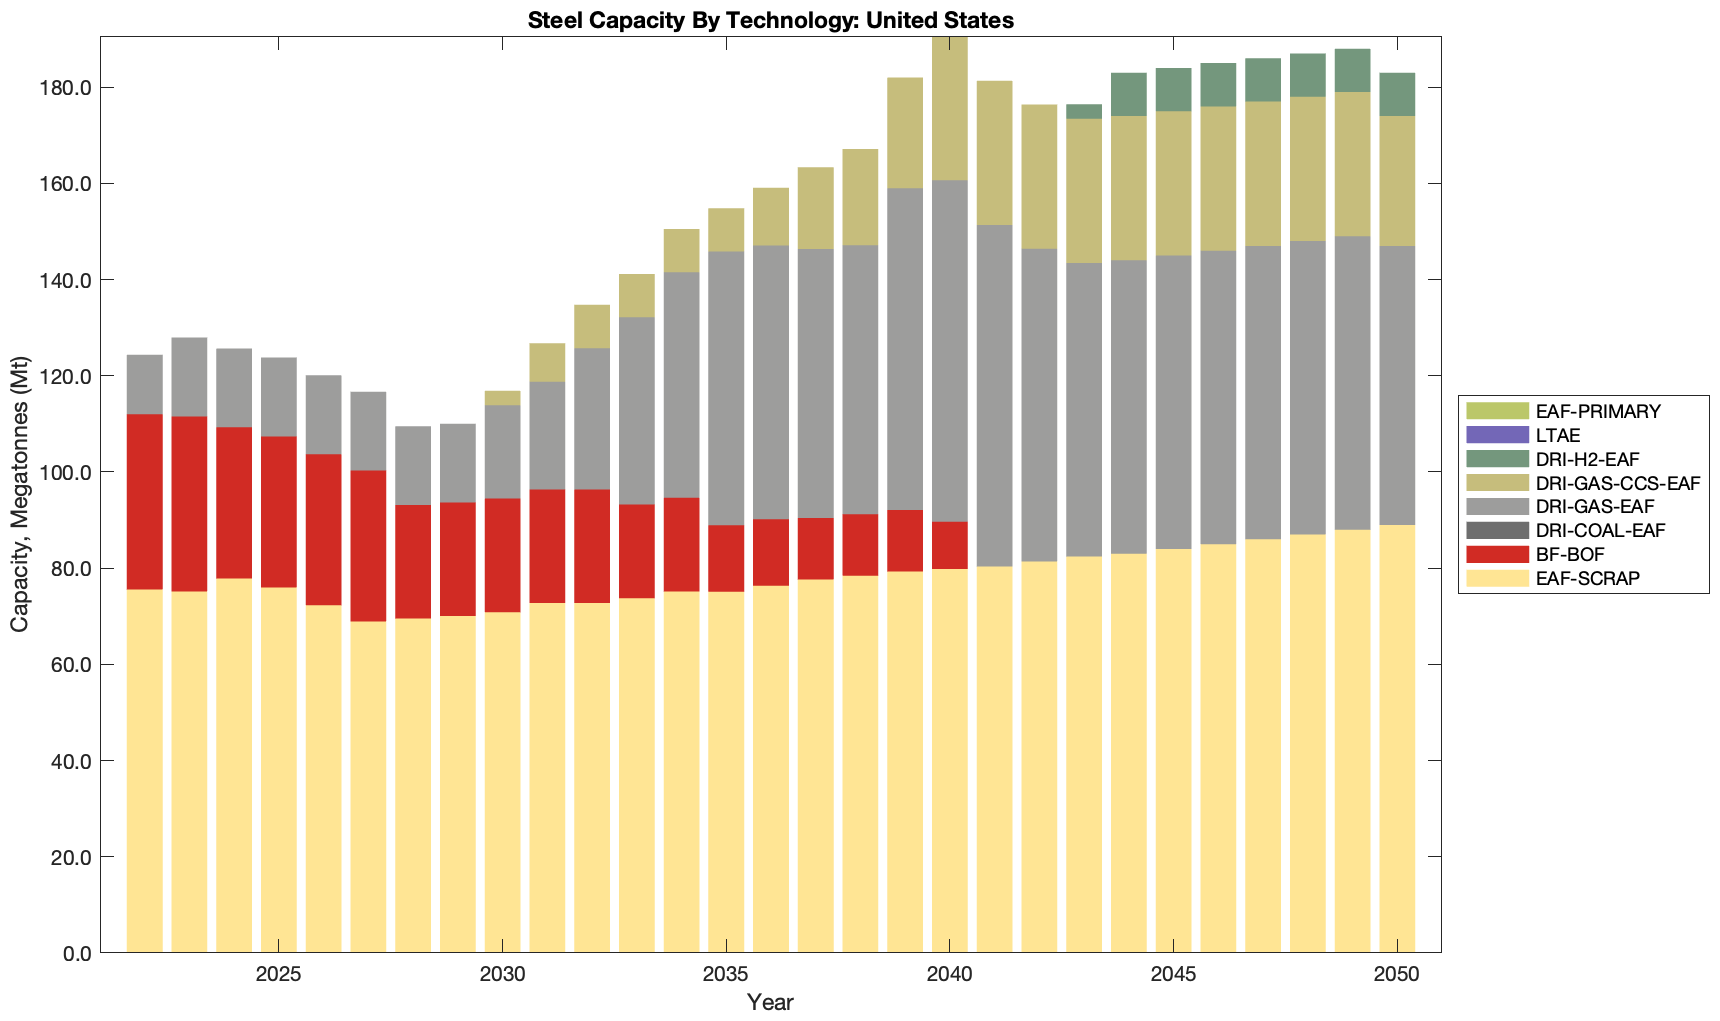
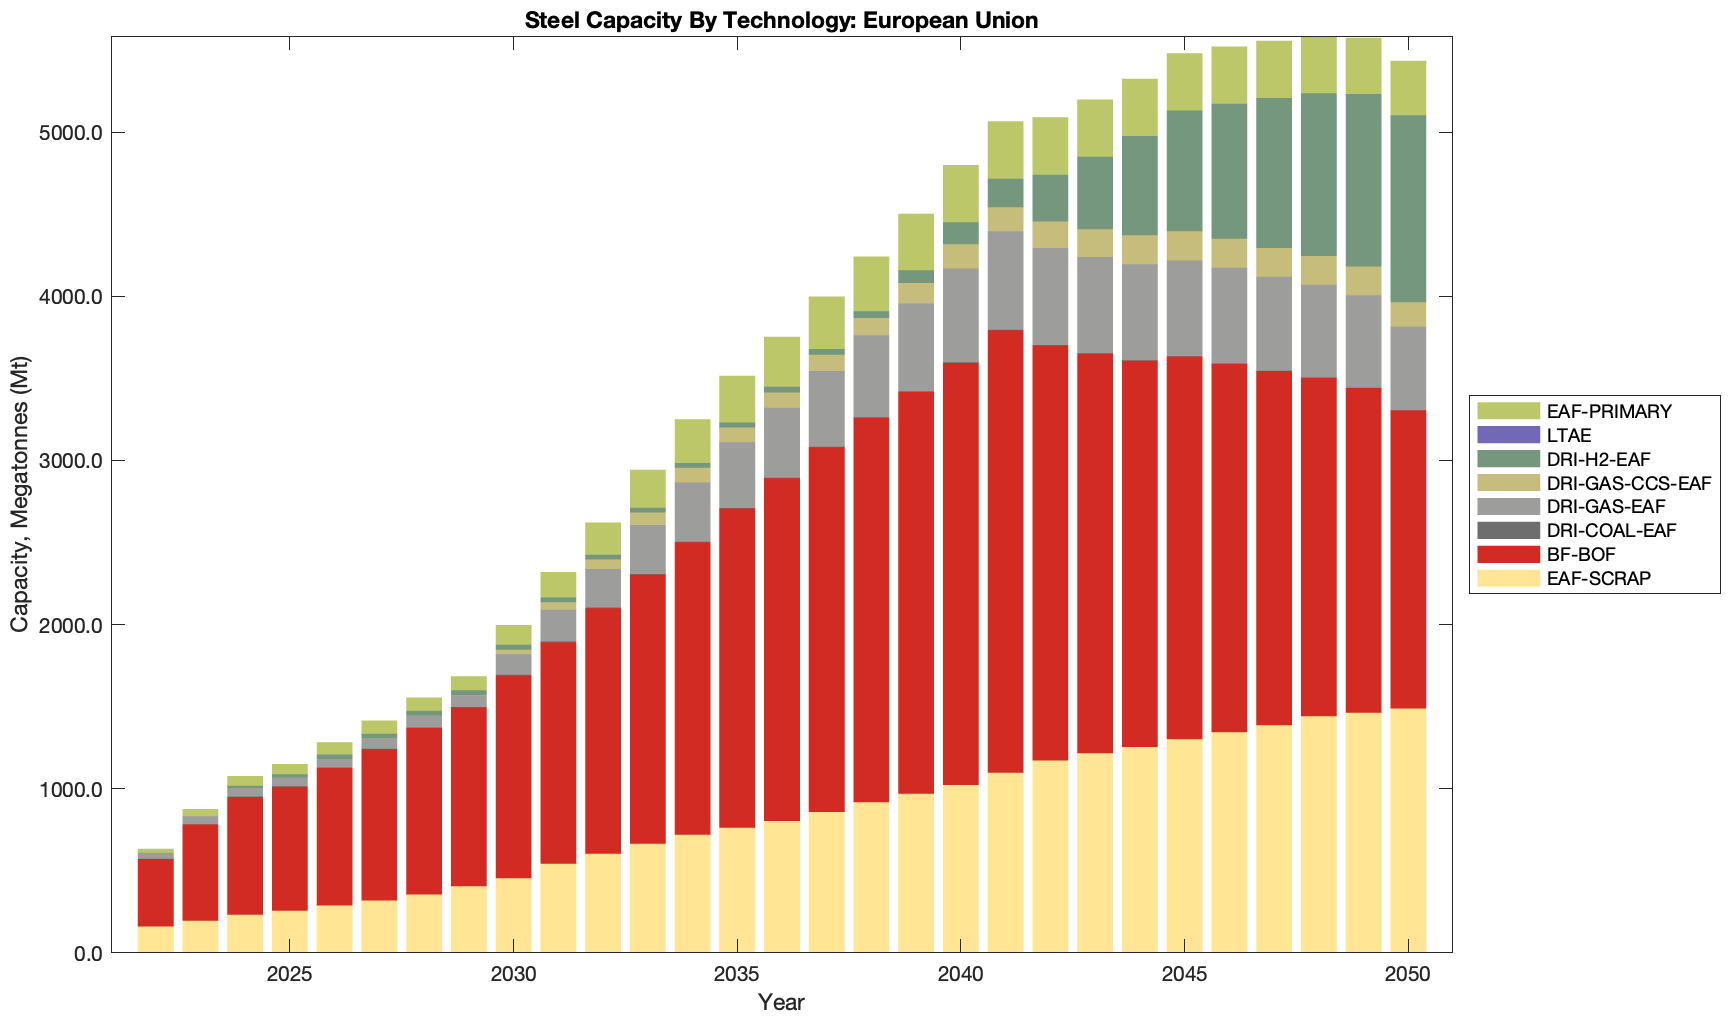
Capacities
China
India
Japan
South Korea
United States
European Union
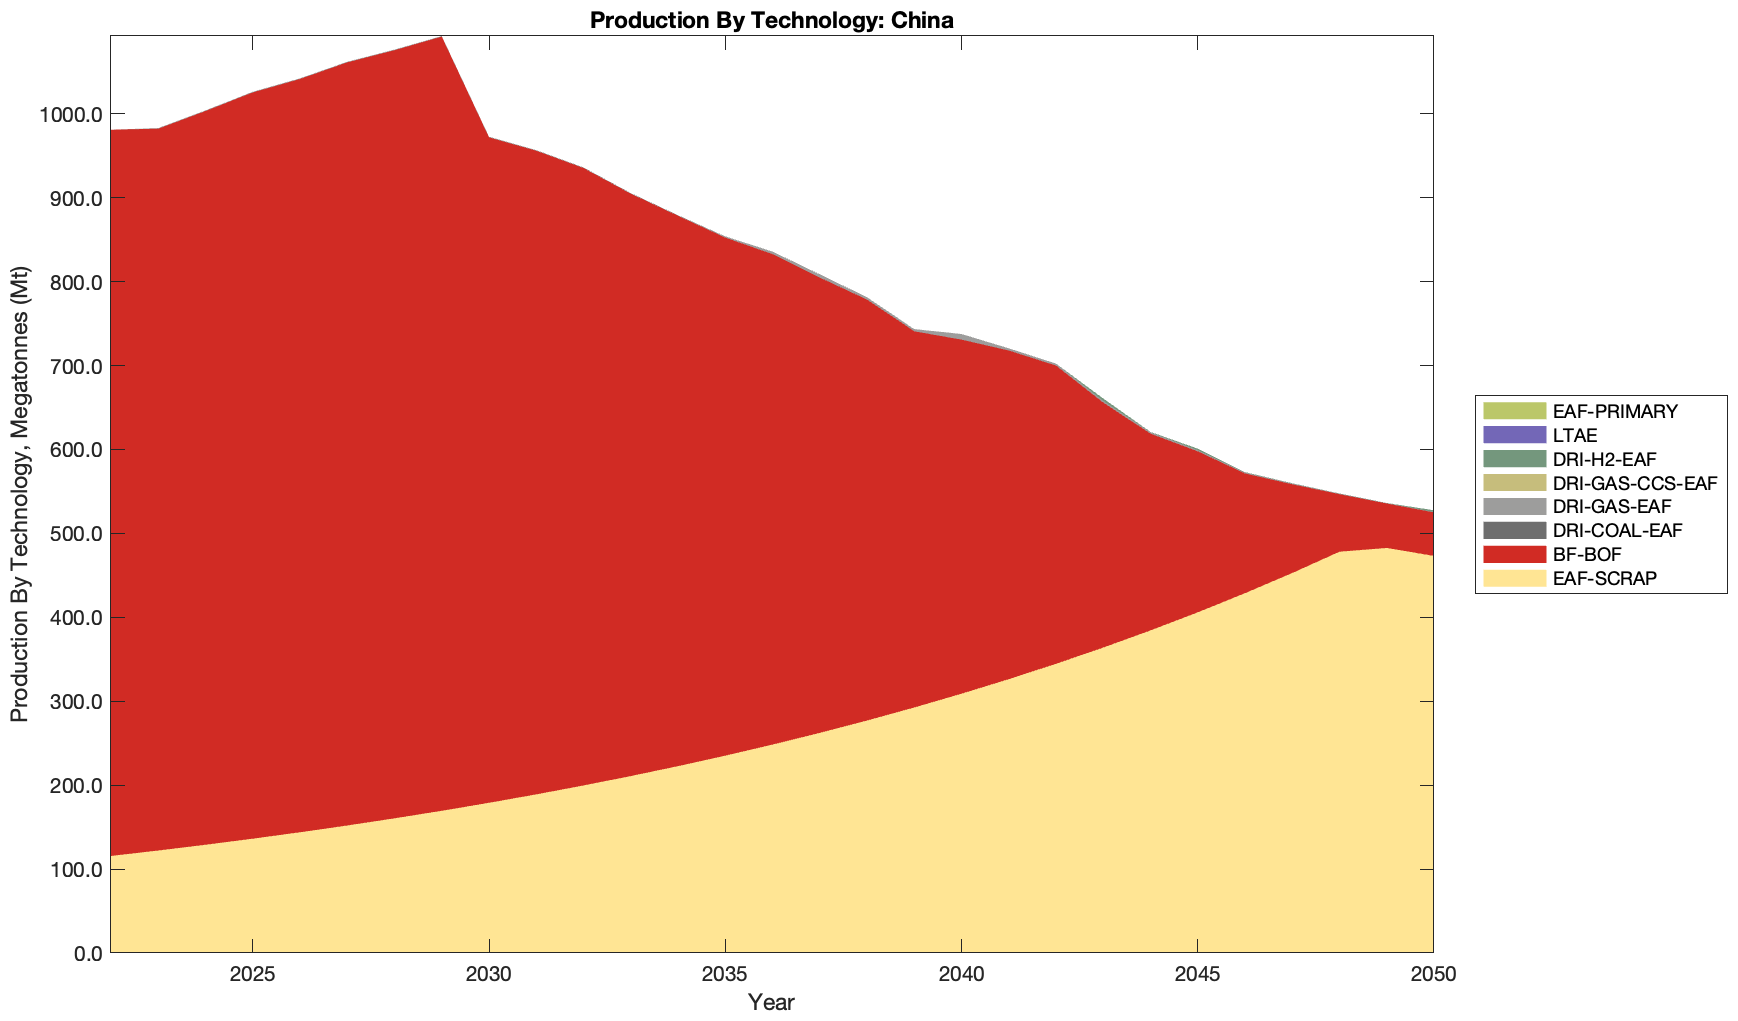
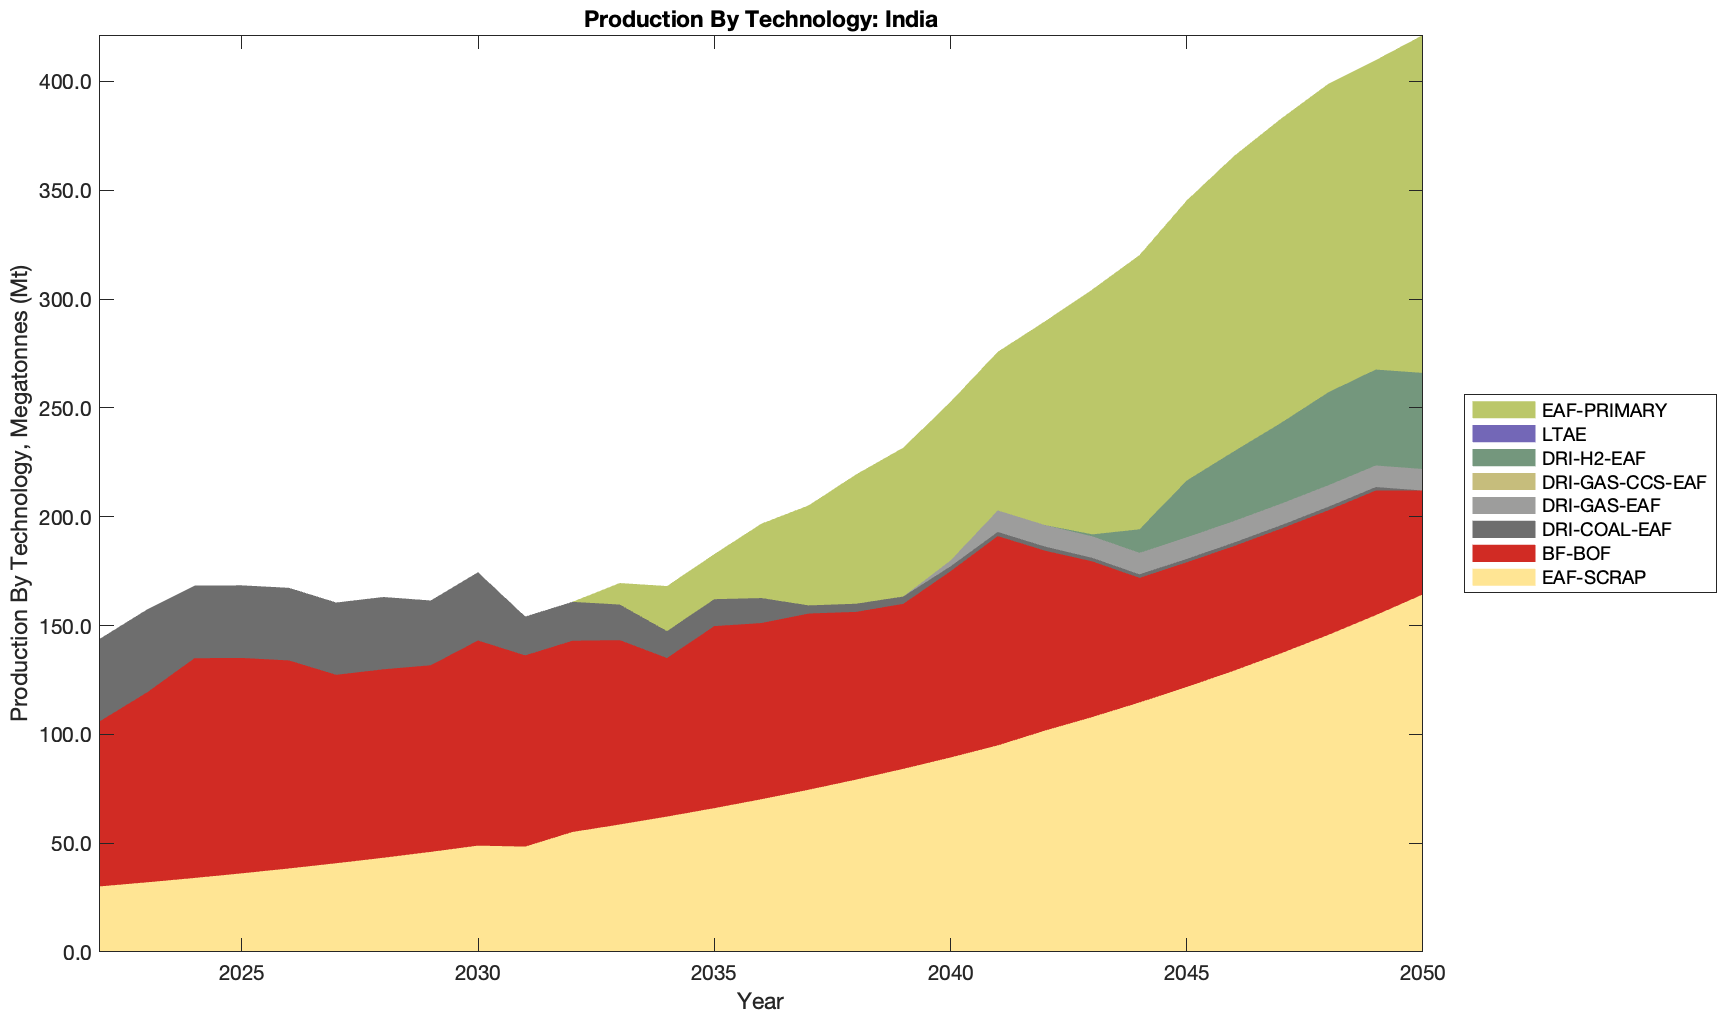
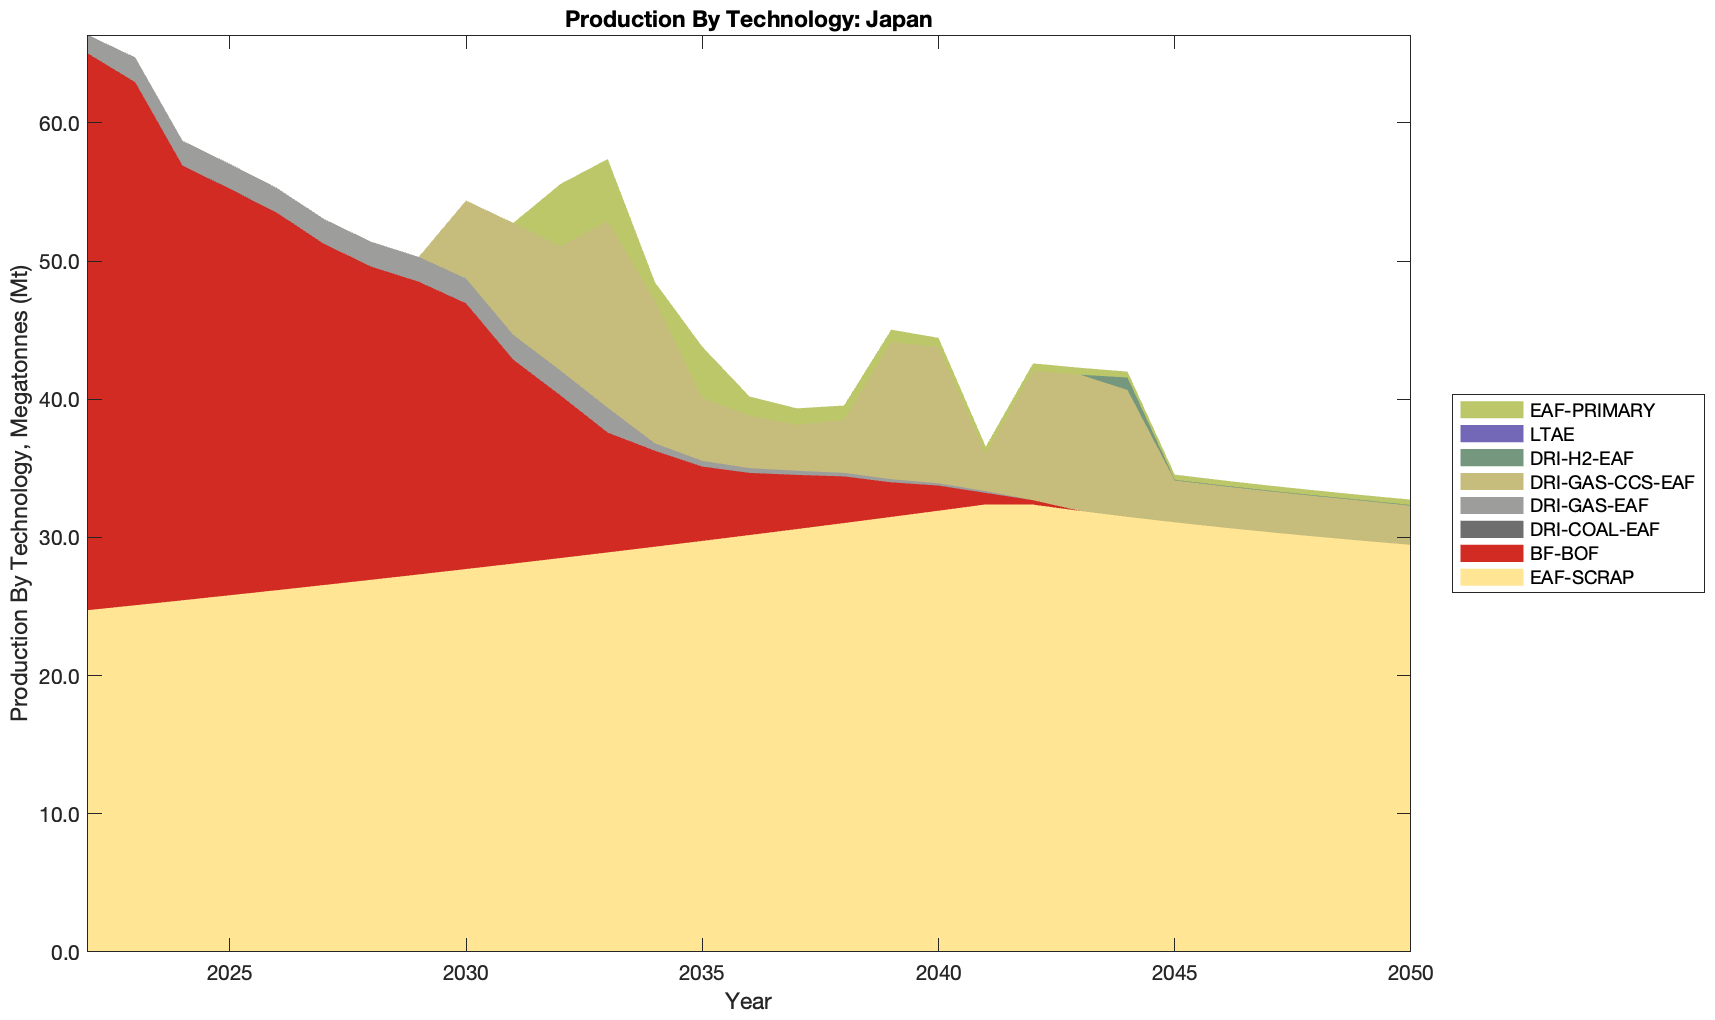
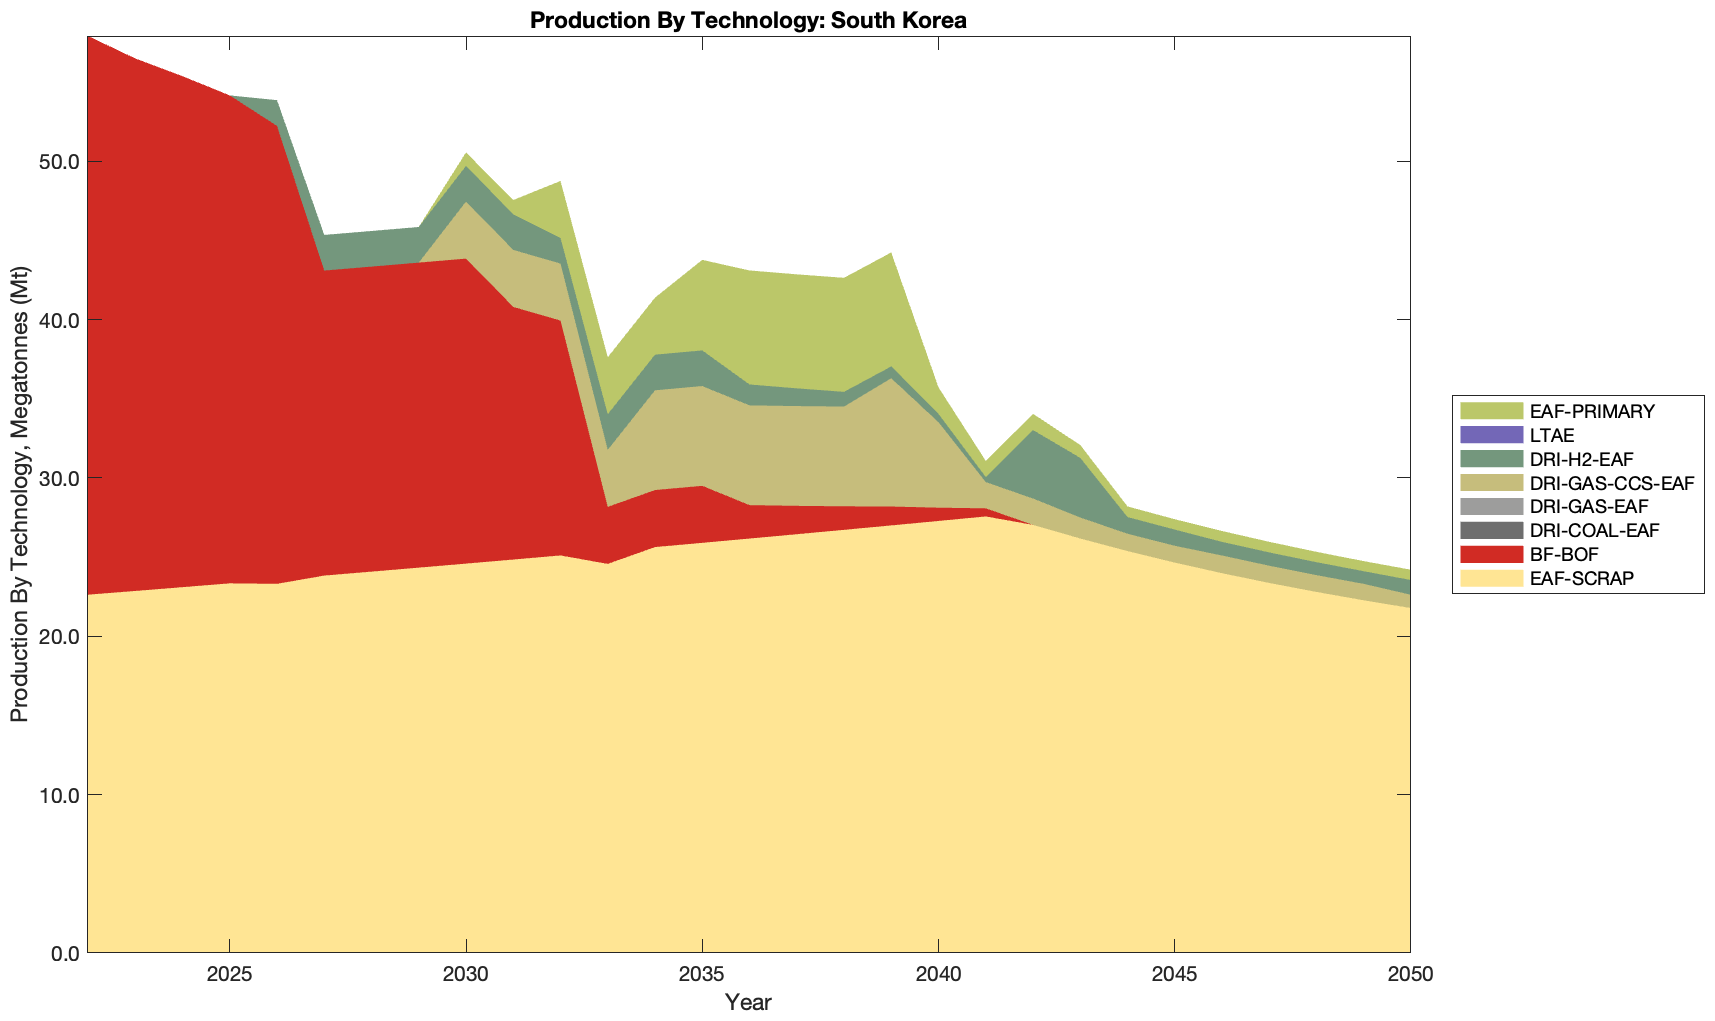
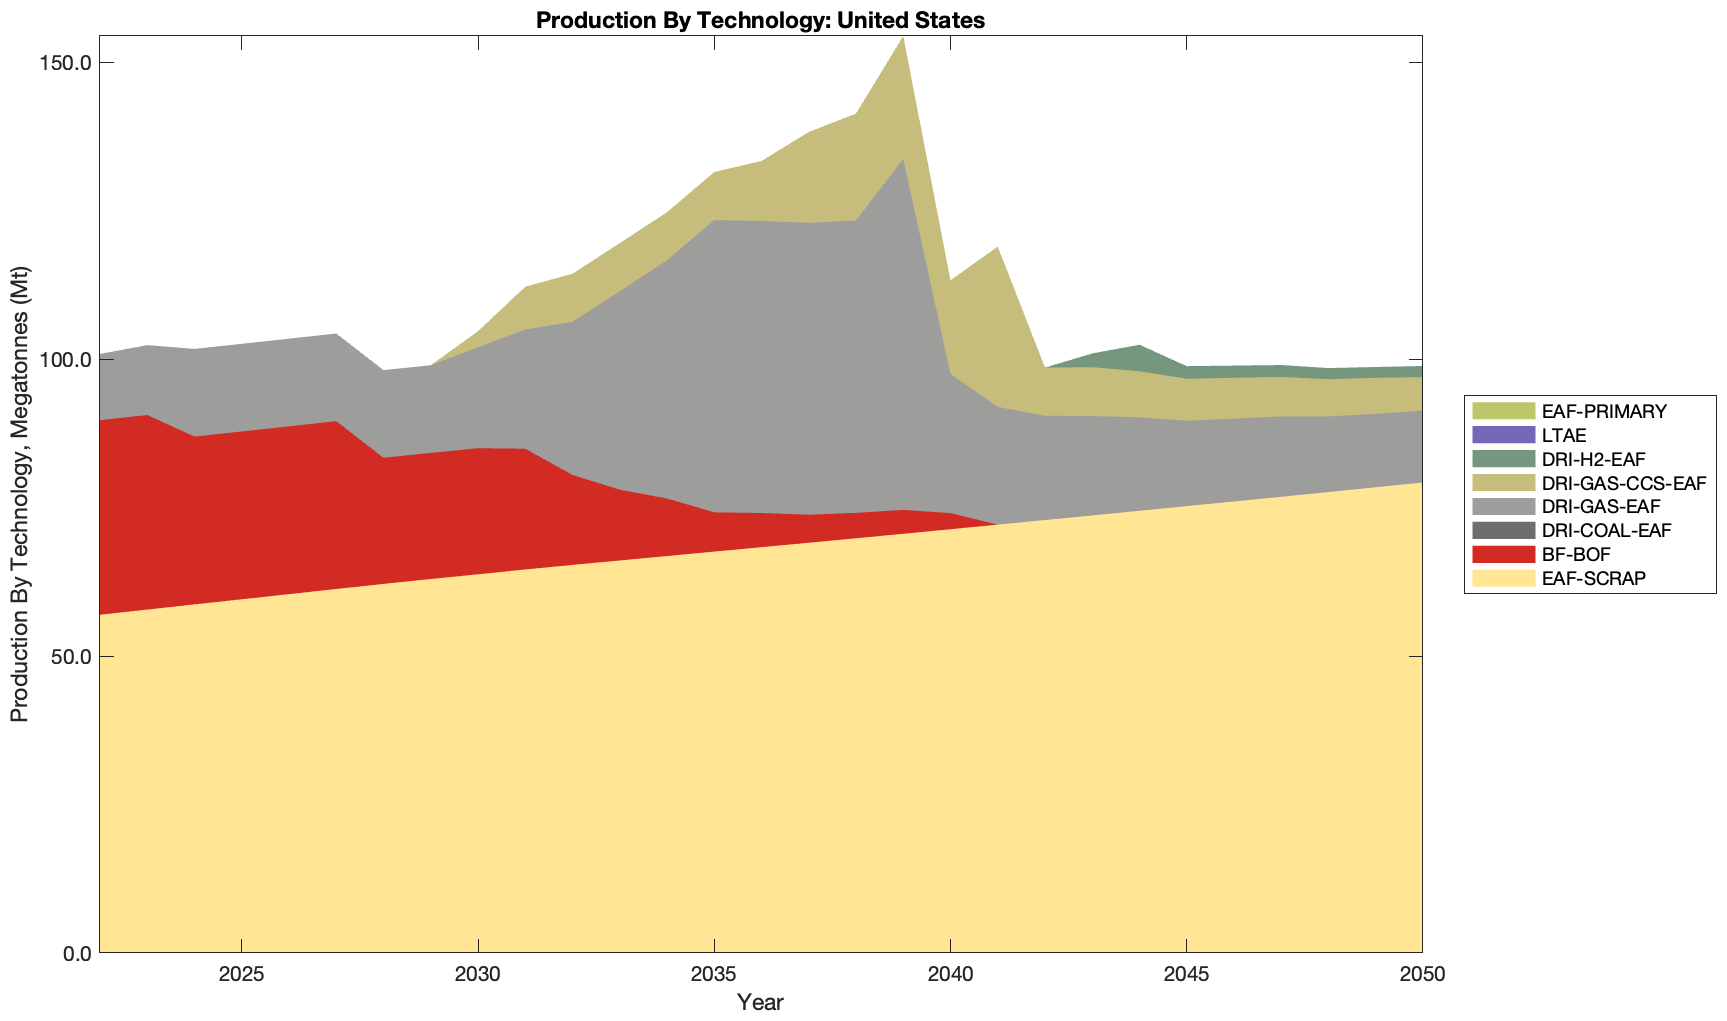
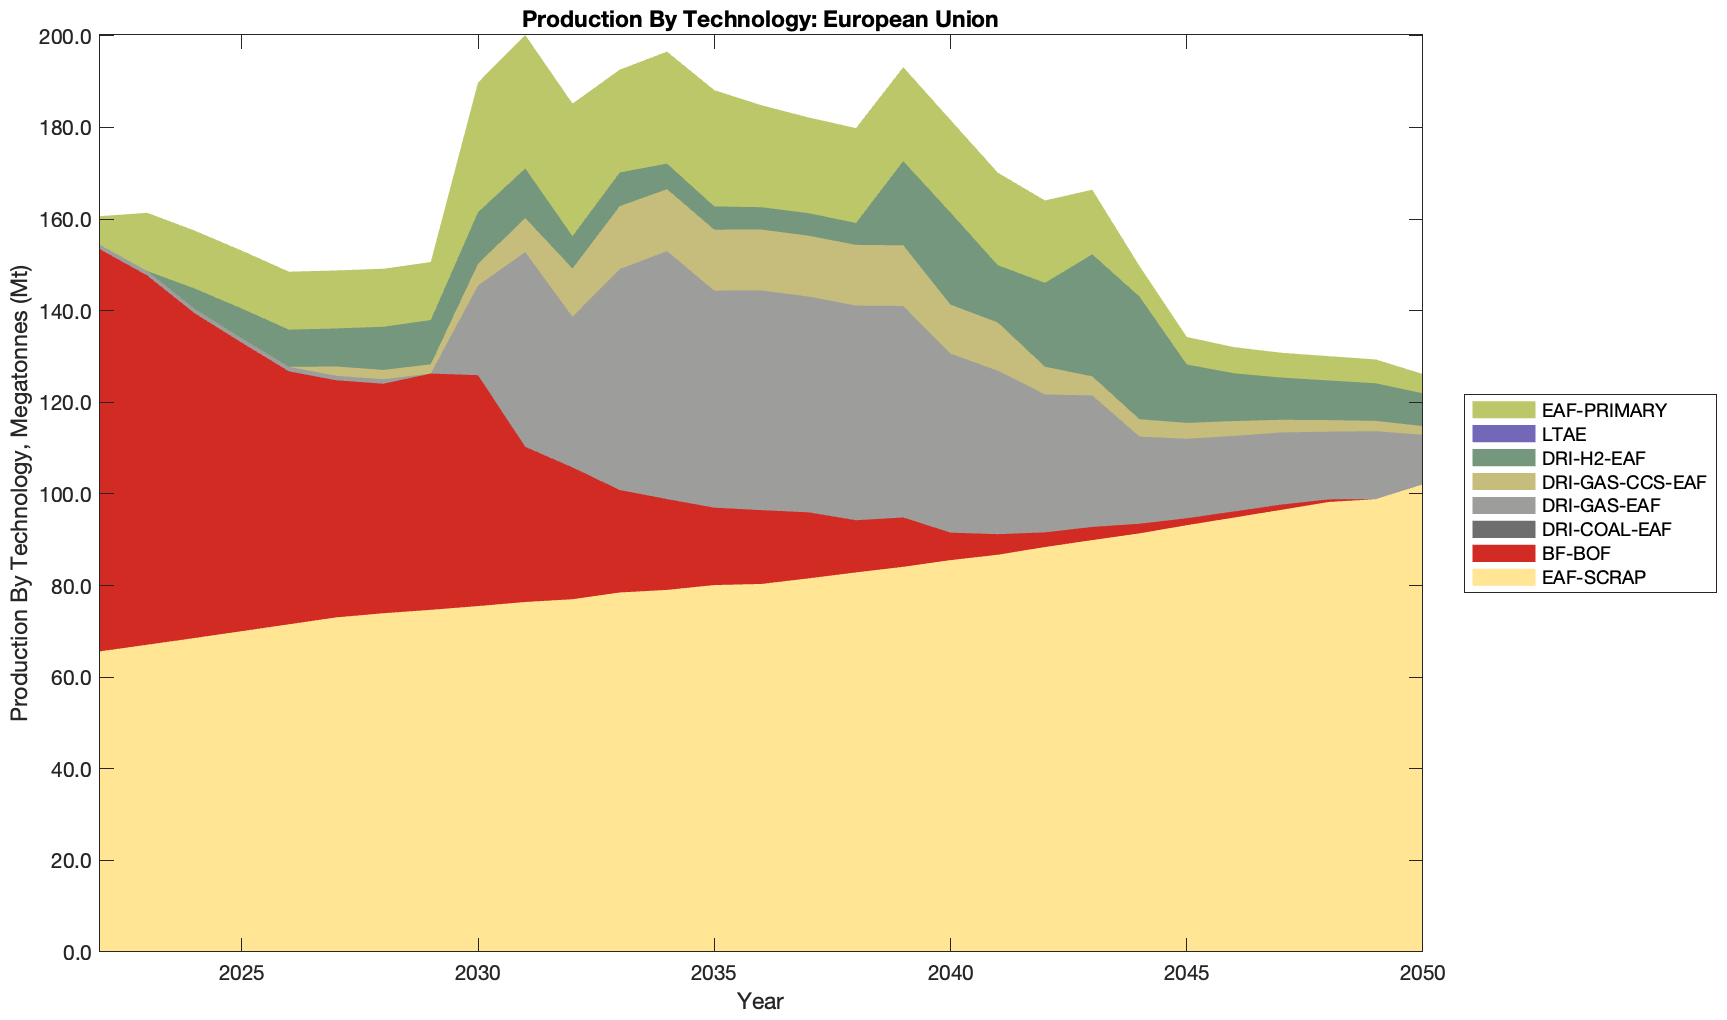
Production
China
India
Japan
South Korea
United States
European Union
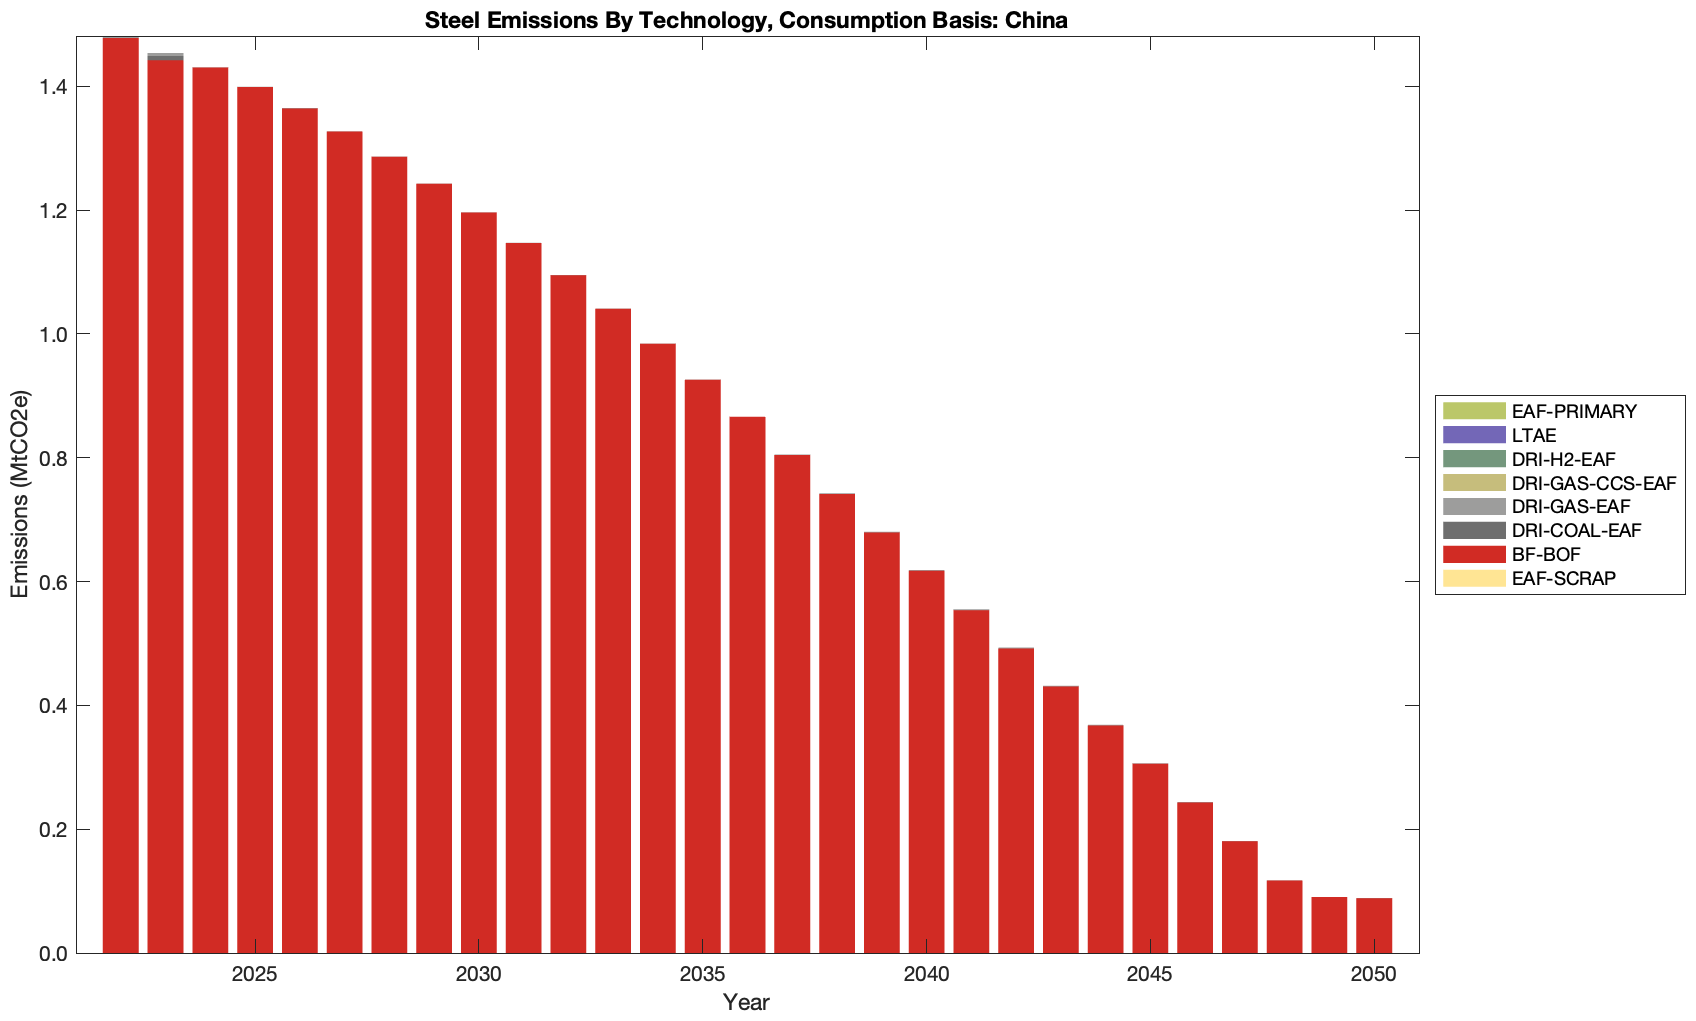
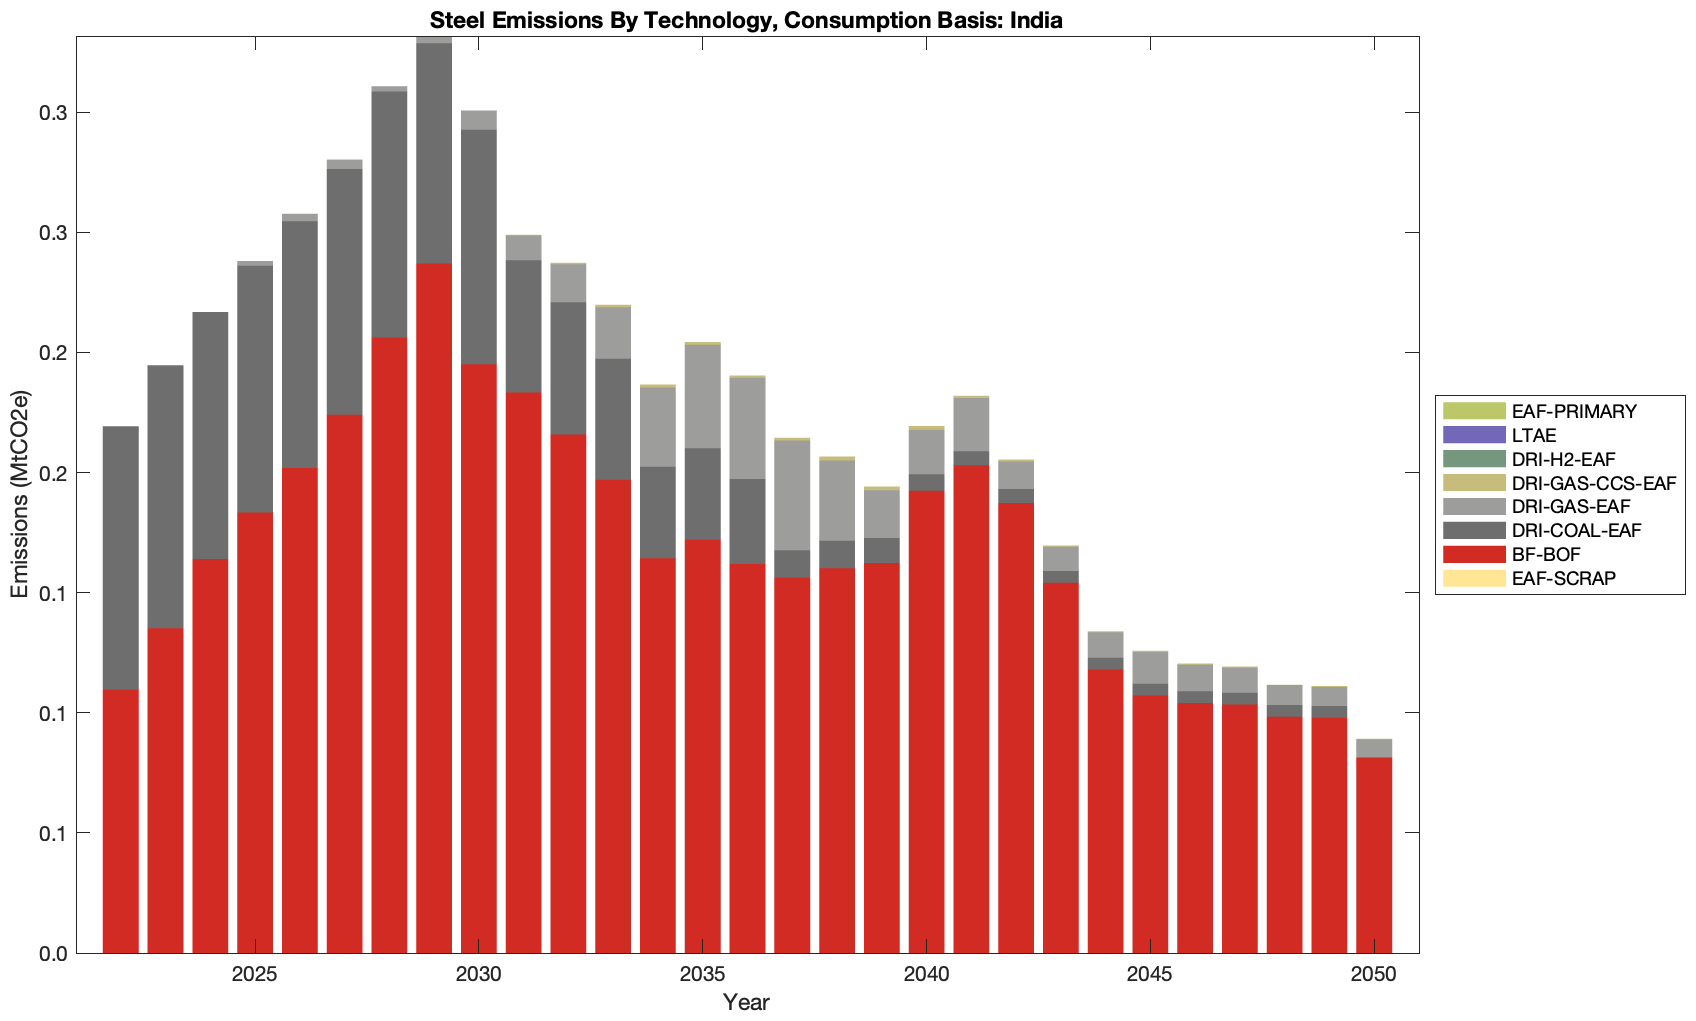
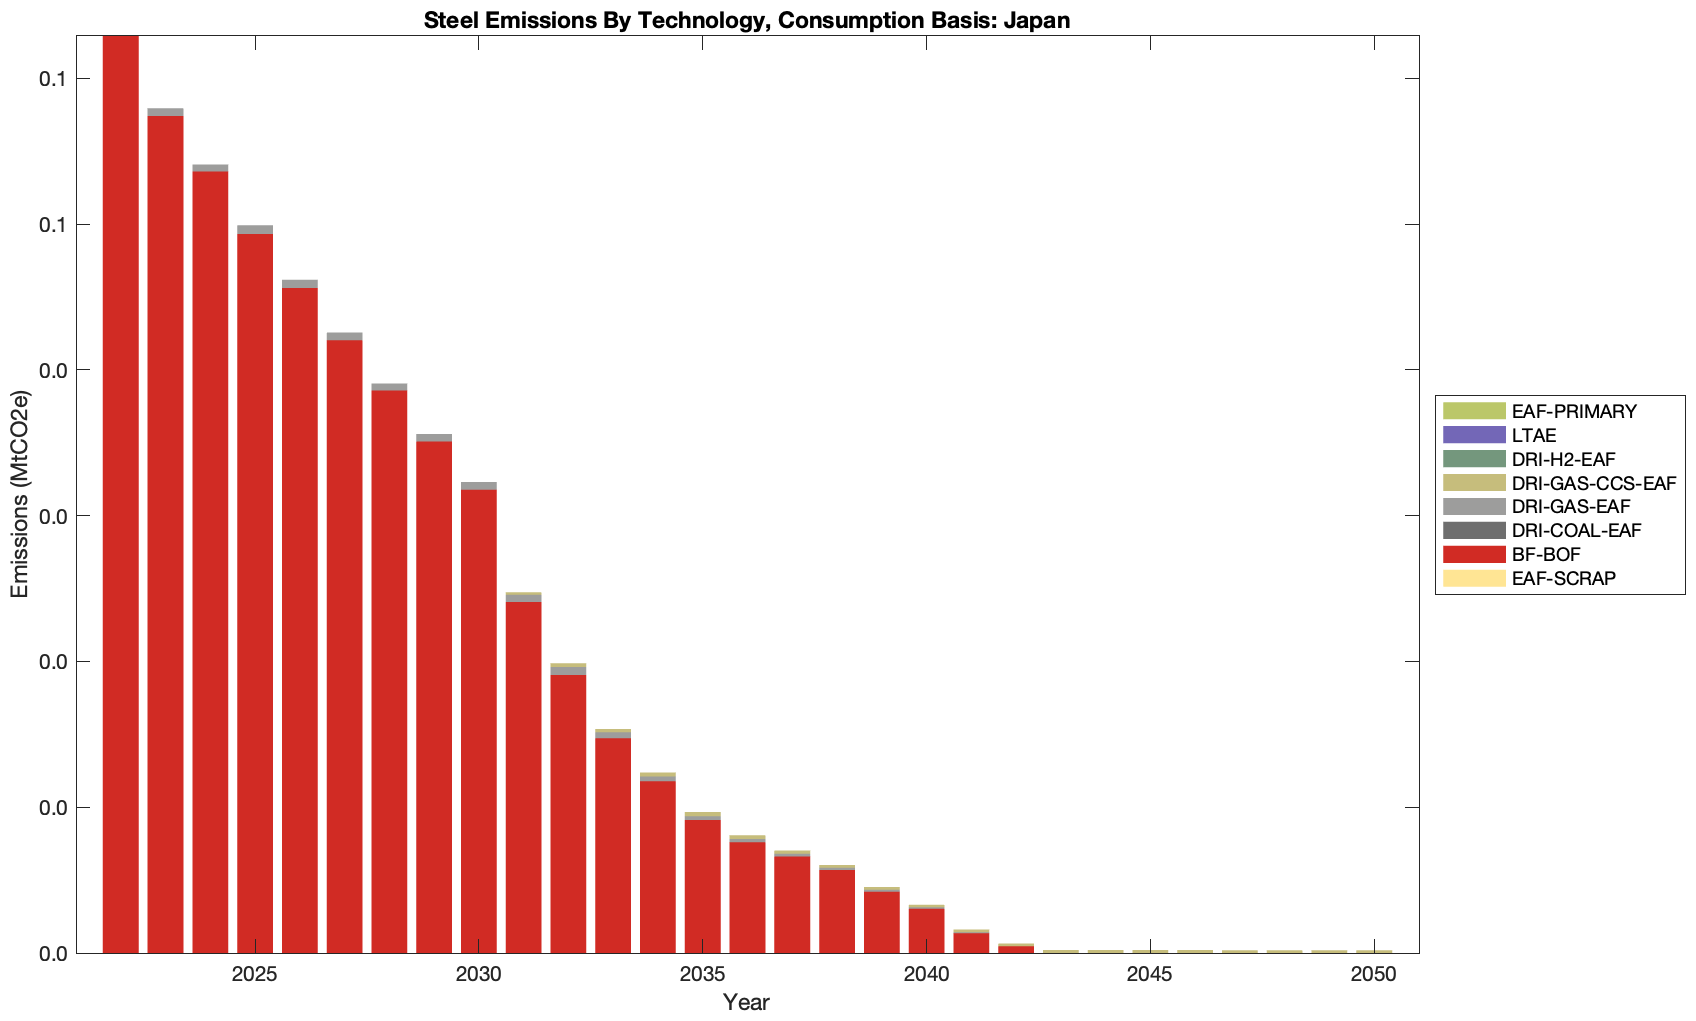
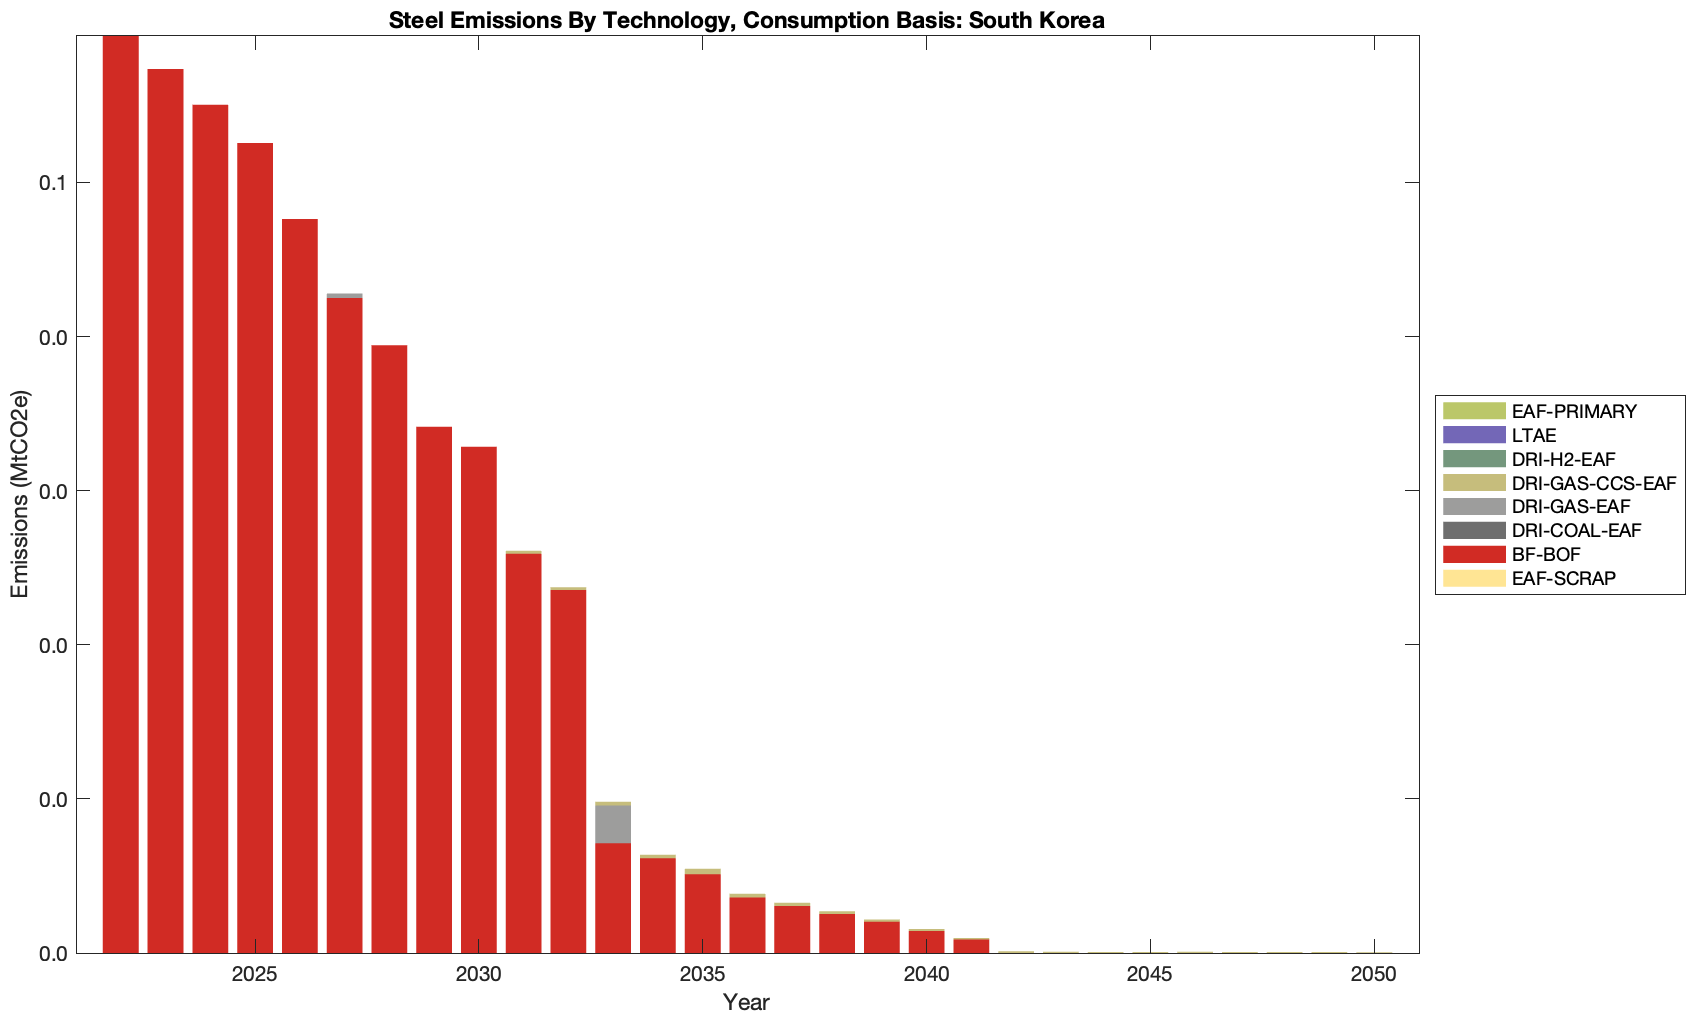
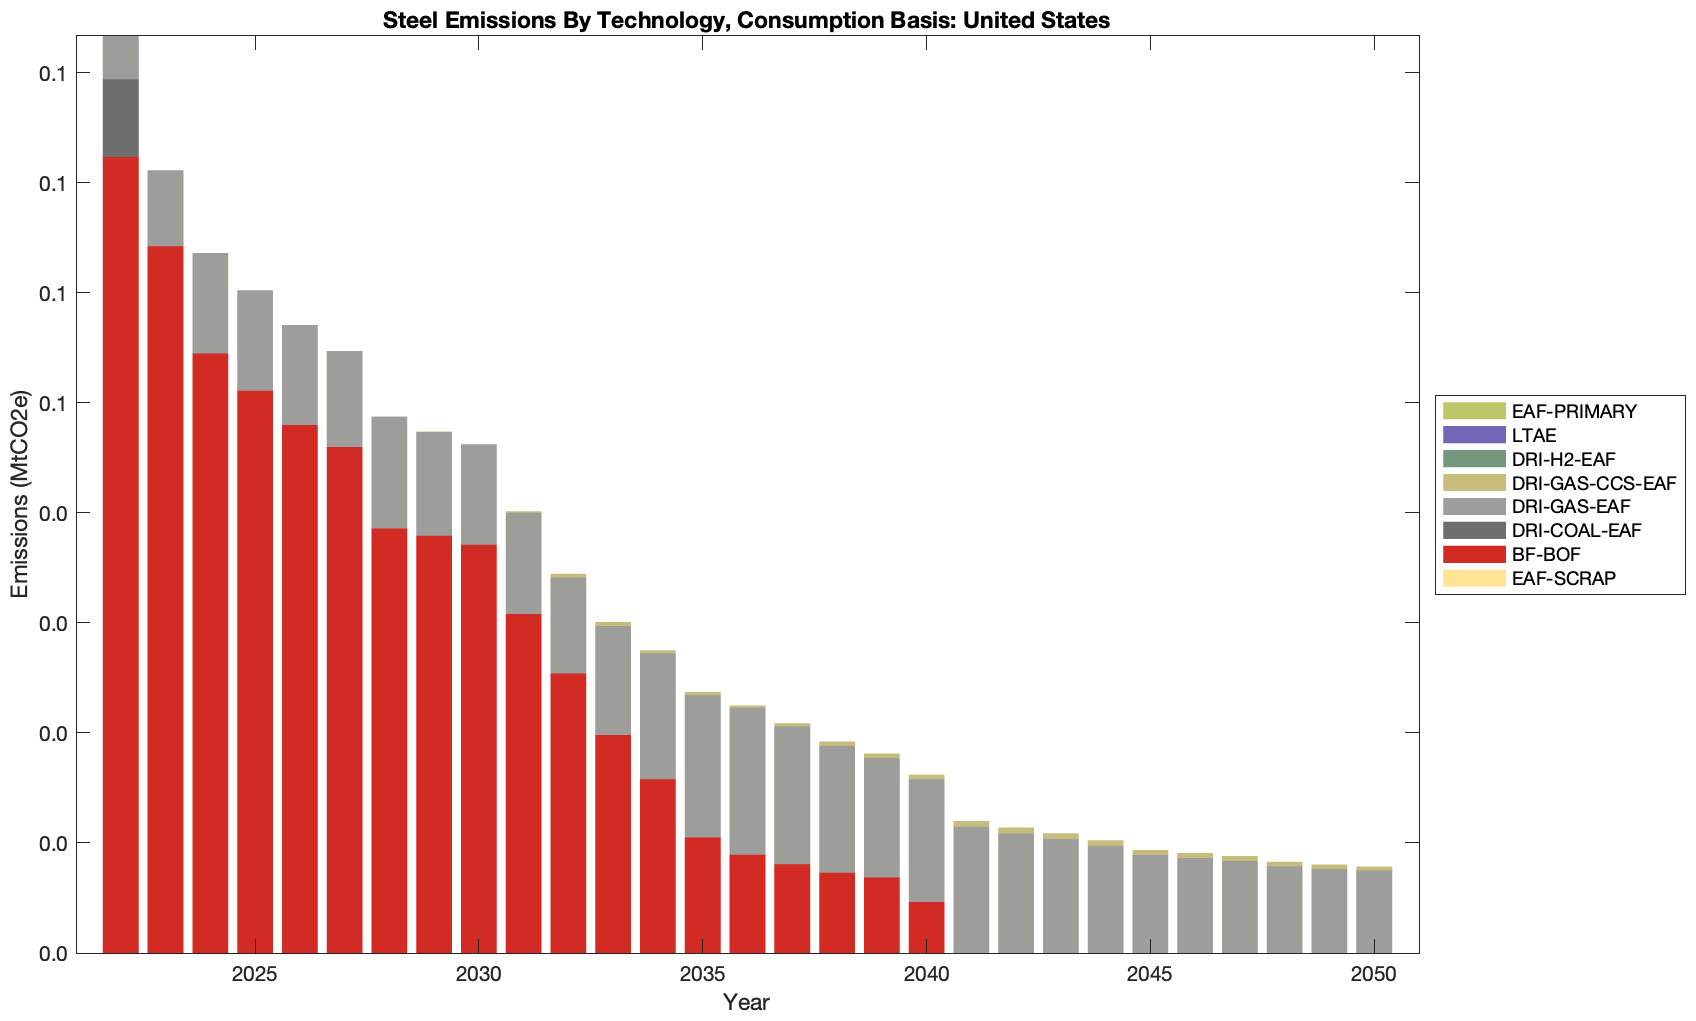
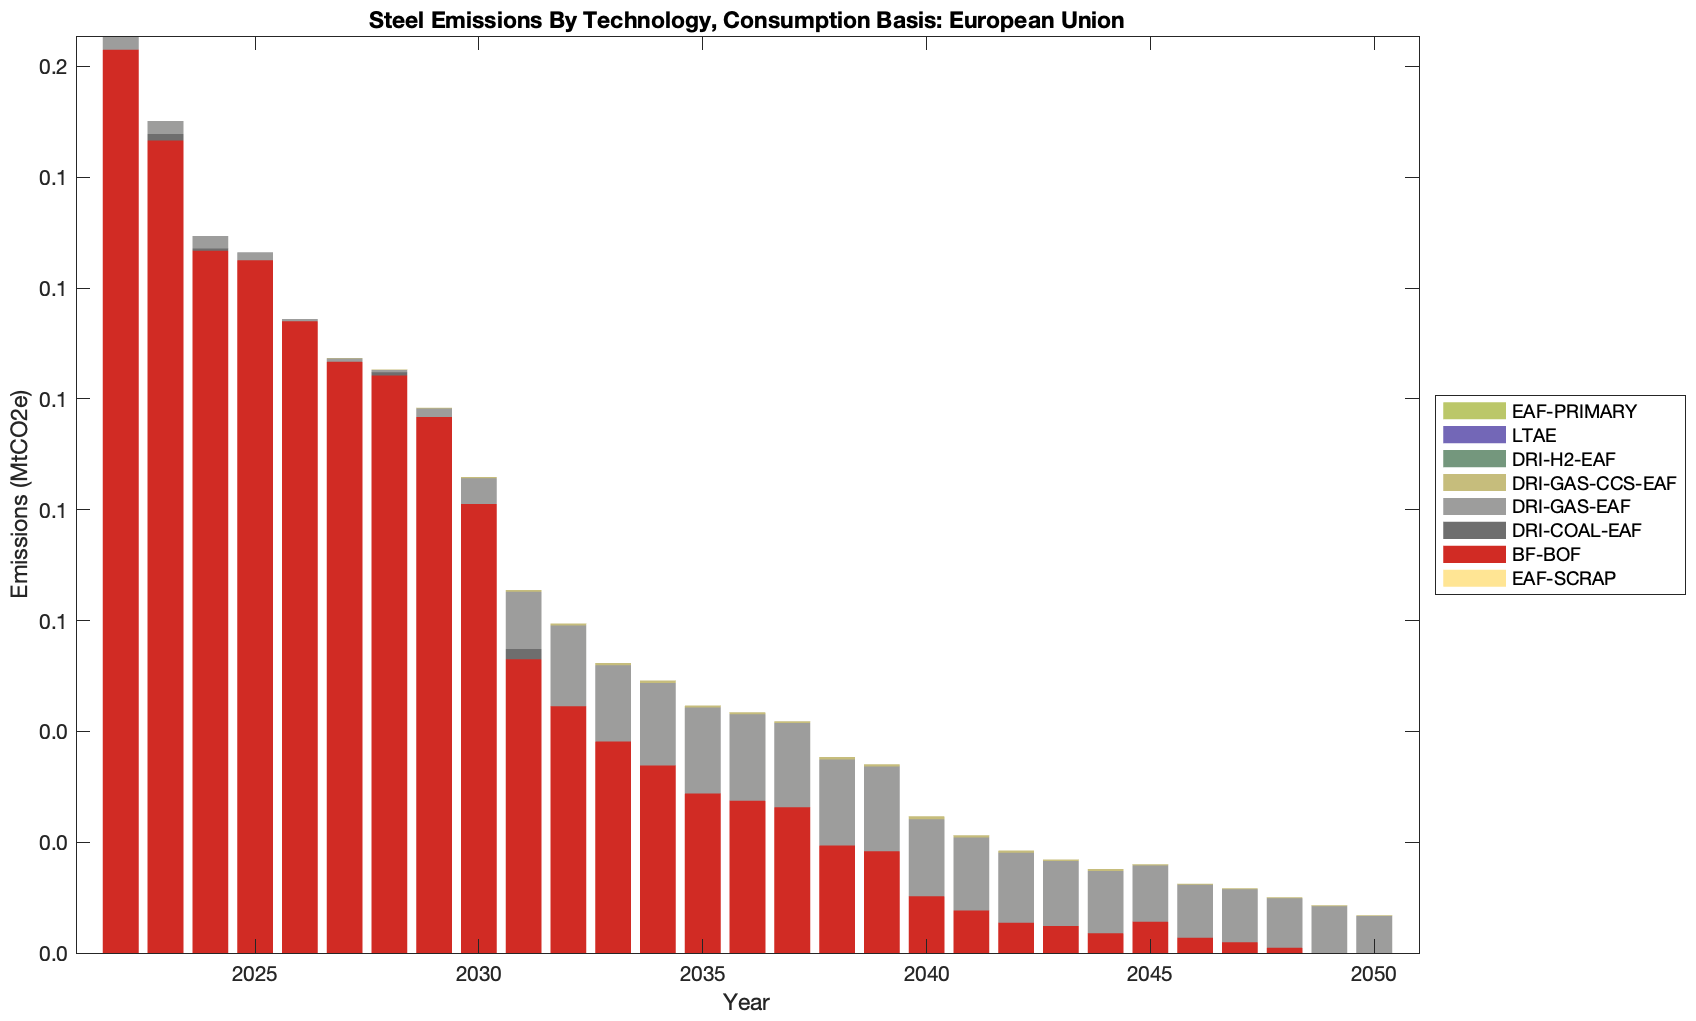
Emissions
China
India
Japan
South Korea
United States
European Union
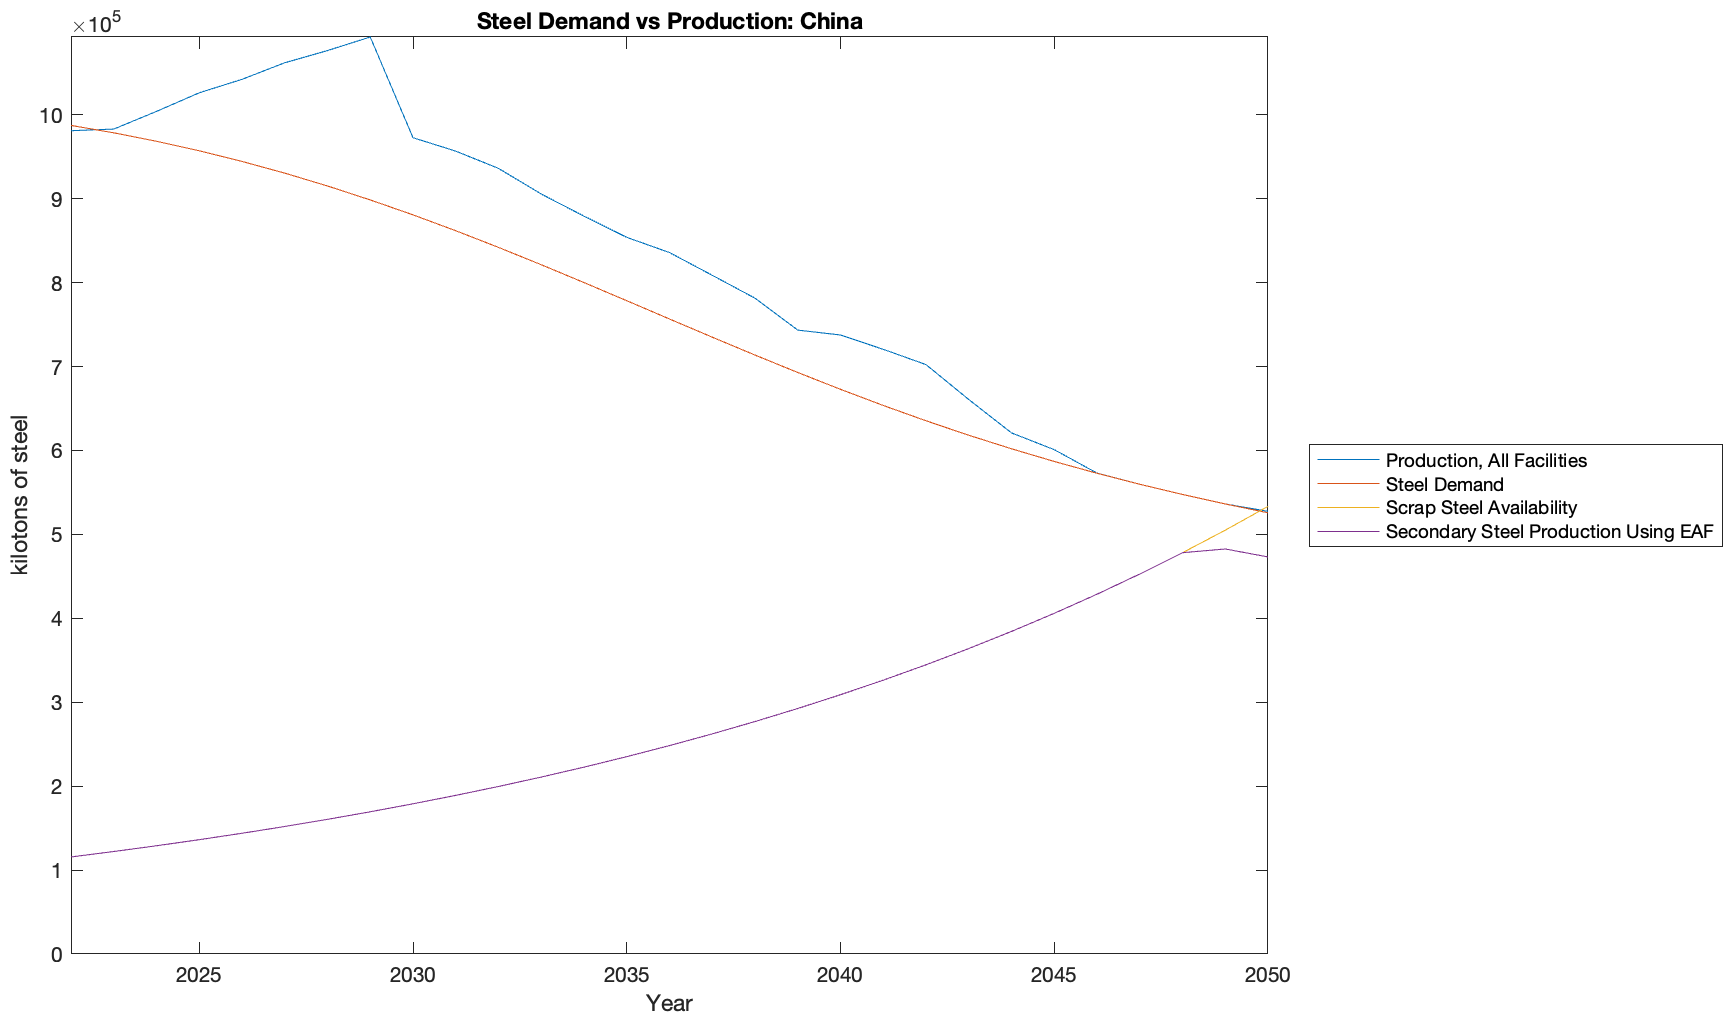
Demand vs production
China
India
Japan
South Korea
United States
European Union